This site uses tracking information. Visit our privacy policy. Click to agree to this policy and not see this again.

The University of Iowa
Department of Ophthalmology and Visual Sciences
Imaging techniques for assessing the structure and function of the cornea and anterior segment are crucial for diagnosing and treating a wide variety of ocular diseases. There is a huge variety of diagnostic testing available to ophthalmologists, and learning how to interpret these tests can seem daunting. For those beginning training in ophthalmology, the utilization of common diagnostic tests provides quicker and more accurate diagnosis and management of corneal diseases. The goal of this tutorial is to explain the basics of the most commonly used corneal imaging techniques at the University of Iowa, including an overview of how they work and how each modality is used in clinical practice.
Corneal topography is used to characterize the shape of the cornea, similar to how one would characterize a mountain using a topographic map. Originally, corneal topography was only used to describe the anterior surface of the cornea. Devices now are able to characterize both the anterior and posterior corneal surfaces, creating a three dimensional map. Advances in digital photography and computer processing have vastly increased the utility of corneal topography (1).
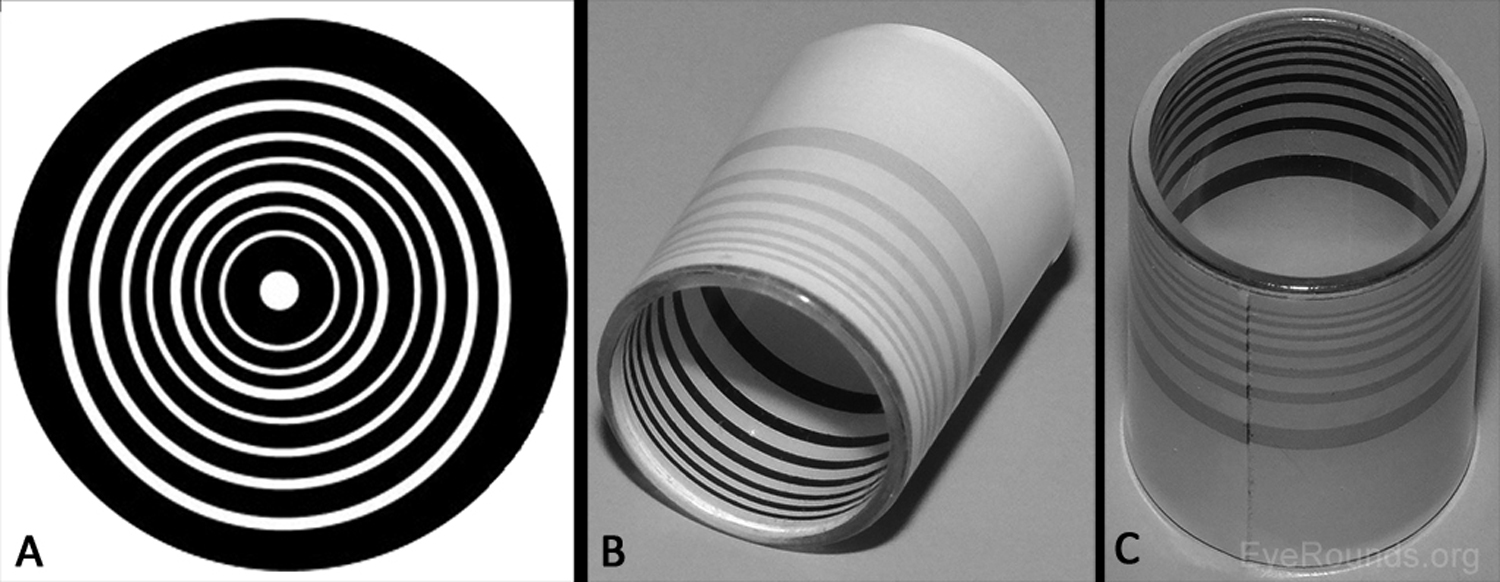
The first advancement in assessing the shape of the anterior corneal surface was made in the late 1800s with the development of the Placido disc (Figure 1A) (1-2). This technique characterizes the corneal surface by assessing the reflection of a set of concentric rings off the anterior corneal surface. As the image from the Placido disc is projected on the cornea, some of the light is reflected off the tear film-air interface like a mirror. The pattern of light reflection reveals the shape of the anterior surface of the cornea (1). Similarly, hand-held keratoscopes (Figure 1B-C) are practical instruments that display concentric rings at the slit lamp for quick assessment of topographical changes (e.g., astigmatism induced by sutures). The posterior corneal surface cannot be characterized using Placido disc technology or a hand-held keratoscope. Many topography machines rings (e.g., Atlas, NIDEK OPD-Scan) still utilize Placido discs but take the technique a step further, providing a computerized quantitative assessment of the corneal surface to provide more detailed information than one can appreciate by simply looking at the reflected.
A second technique for corneal topographic assessment is the scanning slit technique (e.g., Orbscan). This method uses rapidly scanning projected slit beams of light and a camera to capture the reflected beams to create a map of the anterior and posterior corneal surface. A third technique, known as Scheimpflug imaging, uses a rotating camera to photograph corneal cross-sections illuminated by slit beams at different angles (e.g., Pentacam). This method corrects for the non-planar shape of the cornea and, thus, allows greater accuracy and resolution in creating a 3-D map of the cornea (2-3).
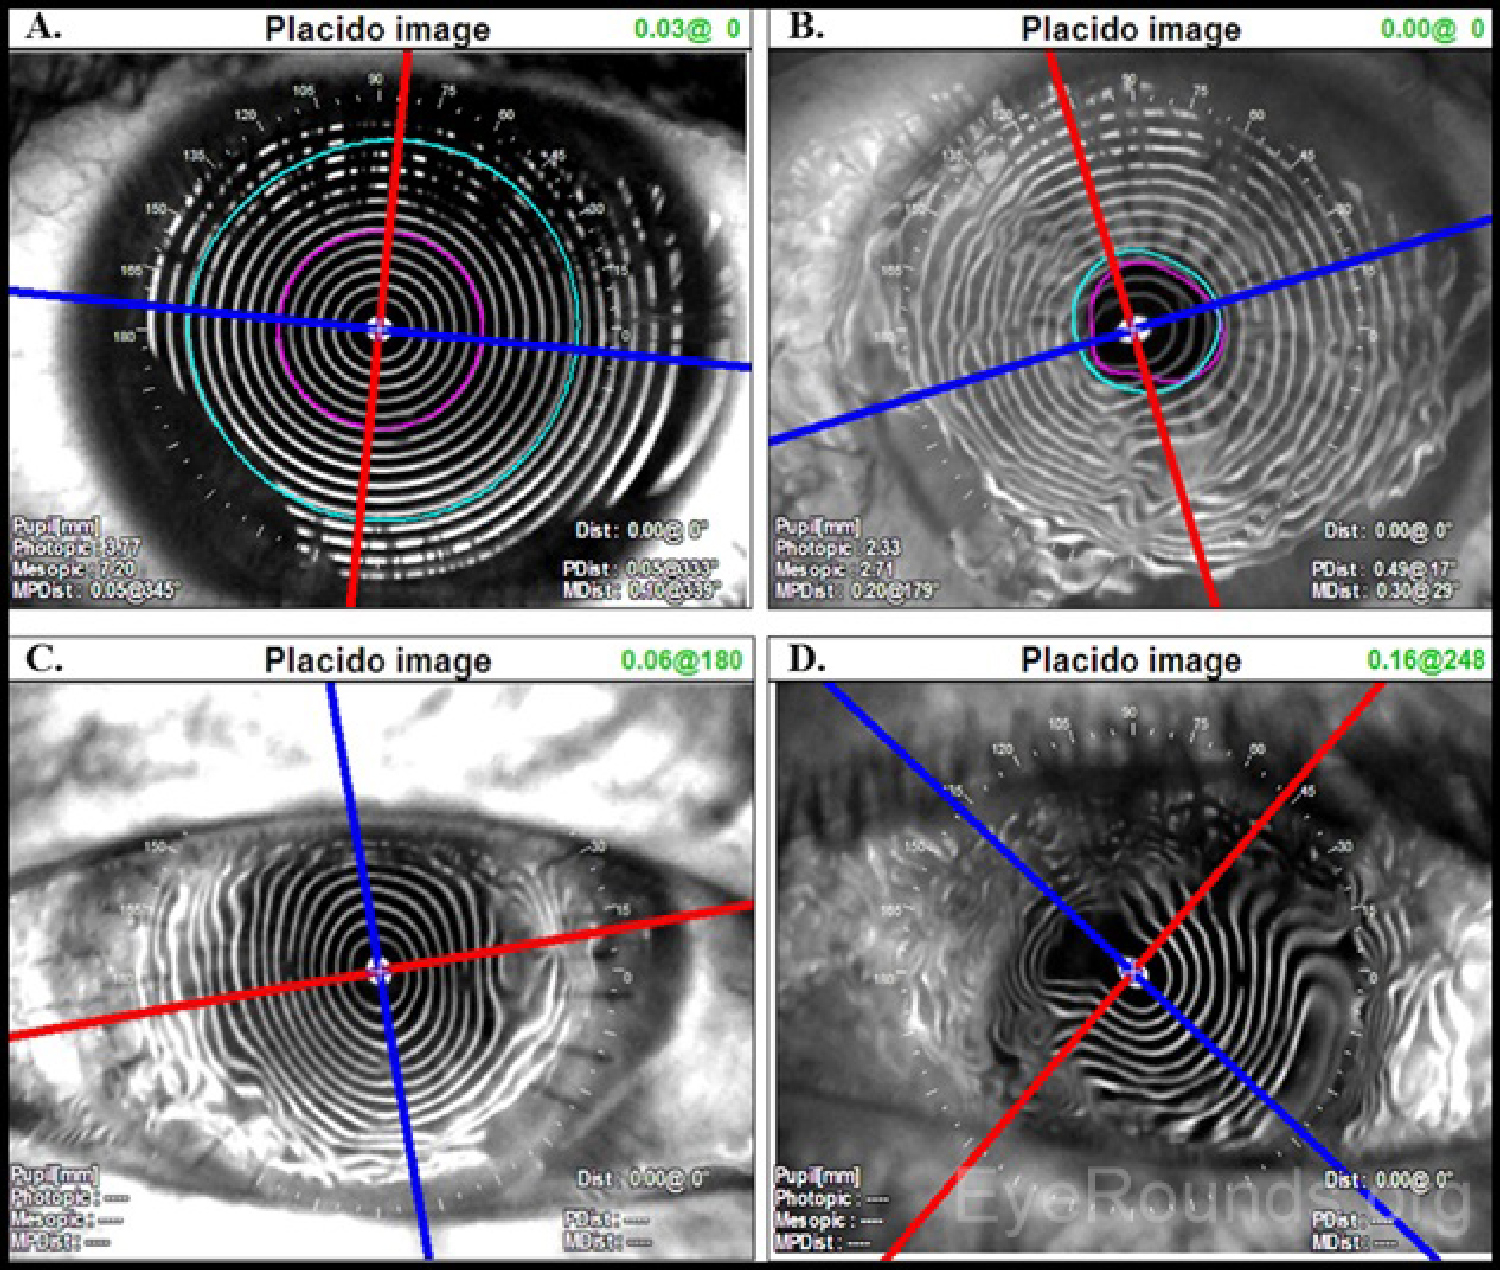
Placido disc images can be interpreted both qualitatively and quantitatively. The projected concentric rings are referred to as "mires." The shape of the corneal surface can be inferred by inspection of these mires. Similar to a topographic map of a mountain, areas where the mires appear closer together correspond to steeper corneal curvature. Areas where the mires are more widely spaced are flatter. The mires can also give information regarding the quality of the surface. Distinct, well-formed mires are referred to as "crisp" and suggest the underlying corneal surface to be regular and smooth.
As an ideal sphere, the cornea should have mires equally spaced over its entire surface (Figure 2A). Minor, insignificant variations are present in every cornea but may not be detectable on qualitative inspection of a Placido disc image. For example, distorted or wavy mires suggest surface irregularities, such as those caused by surface dryness (Figure 2B). Regular astigmatism results in mires that appear ovoid (Figure 2C). If irregular astigmatism is present, this may be seen as an irregularly distorted reflection of the mires (Figure 2D). Placido disc evaluation can also be used to guide suture removal following penetrating keratoplasty. Selectively removing sutures can reduce post-operative astigmatism (Figure 2C).
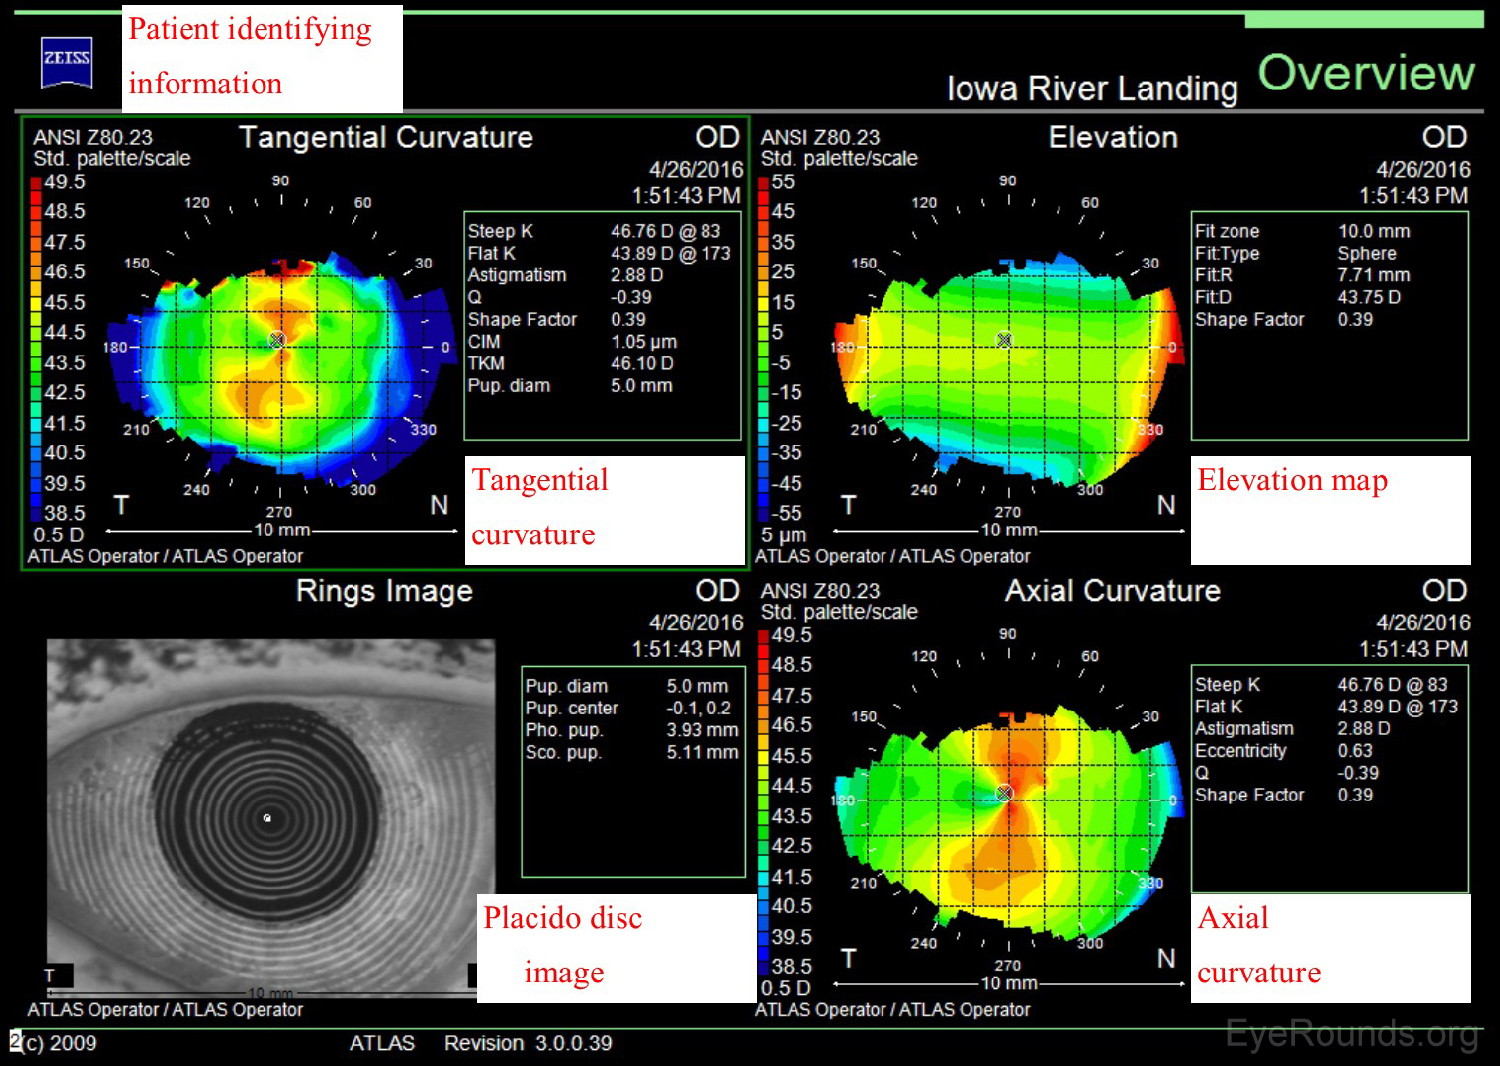
The Zeiss Atlas and NIDEK OPD-Scan are Placido disc-based topographers. As shown in Figure 3, the Zeiss Atlas report includes a Placido disc image and several maps that provide information regarding tangential curvature, axial curvature, and elevation. A tangential, or instantaneous, map is very similar to an axial map. It is a slightly more accurate way of characterizing the corneal curvature but appears more "noisy" and irregular. Axial maps are less sensitive at measuring the corneal curvature and, thus, are used mainly for screening purposes (4-5).
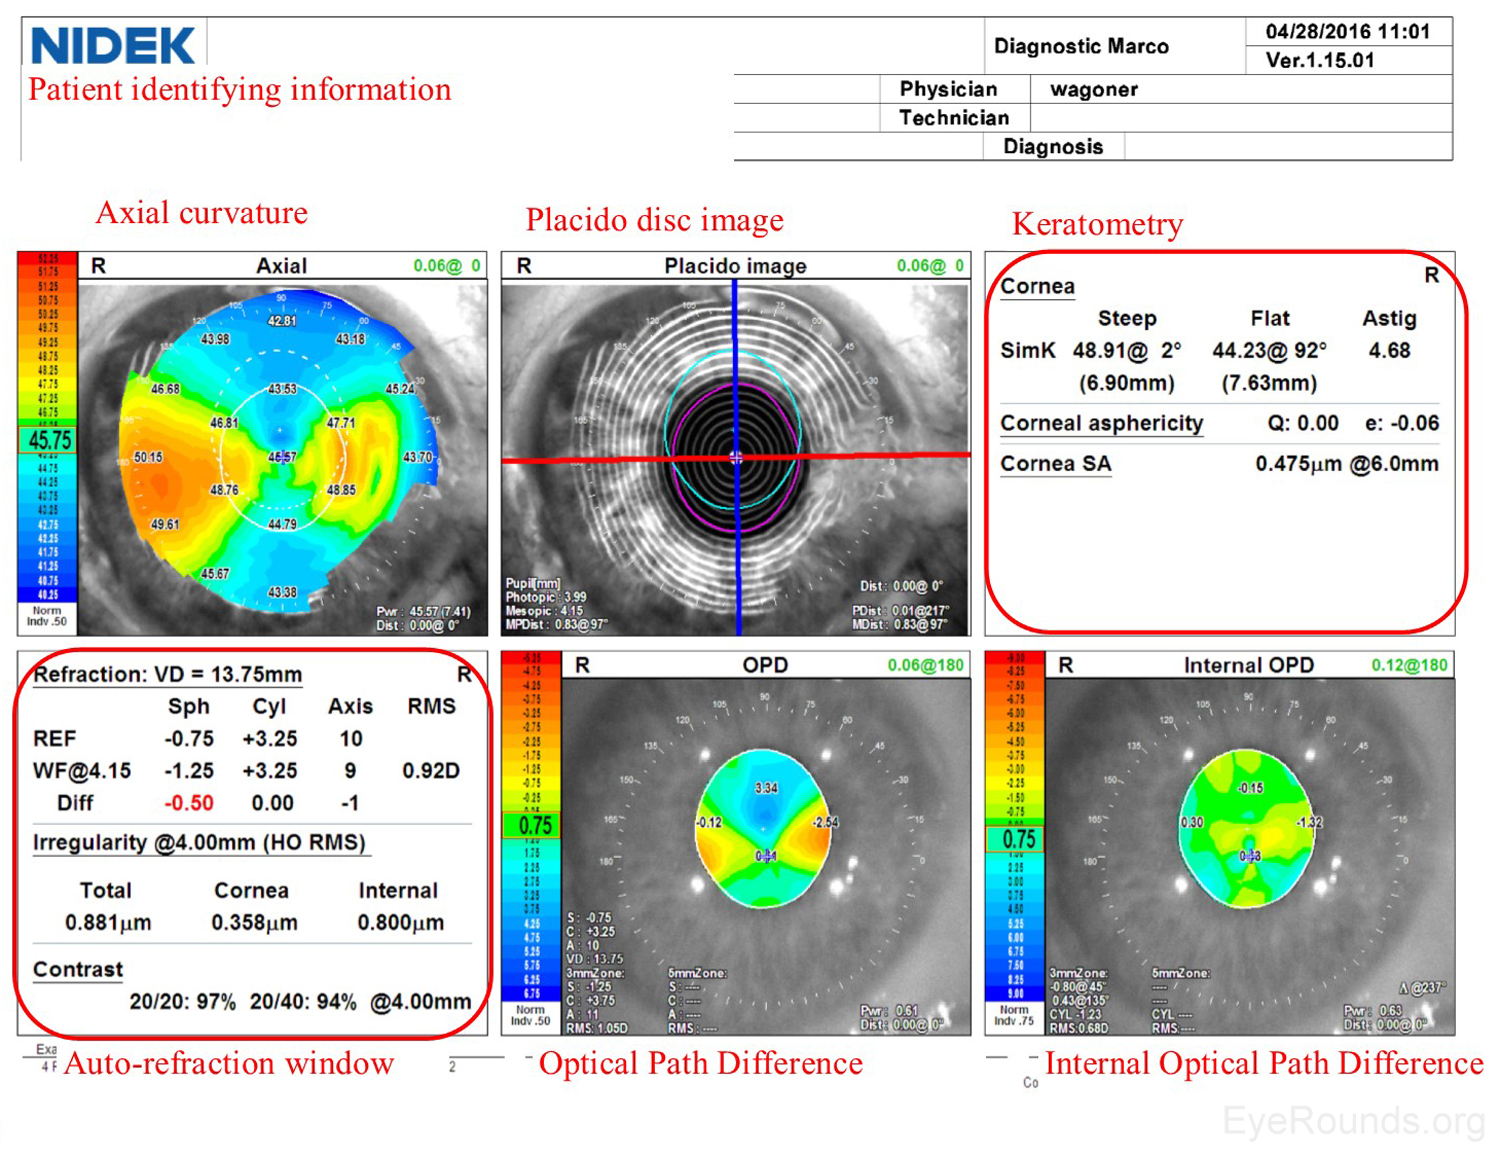
Similar to a Zeiss Atlas report, the NIDEK imaging report provides an axial curvature map and a Placido disc image. The NIDEK instrument also provides keratometry data, which are simulated measurements providing the dioptric refractive power in the two primary meridians. The patient's refractive error is approximated using both the autorefraction (REF) and wavefront (WF) measurements, and this refraction estimate is available in the auto-refraction window of the NIDEK report. Two additional maps are included from the NIDEK testing that are not available by other modalities: the Optical Path Difference (OPD) and the Internal OPD maps. The OPD specifically detects the total refractive error (in diopters) in the eye, including aberrations in the cornea, lens and other structures, whereas the Internal OPD map captures the refractive error contributed by internal structures of the eye by subtracting the corneal refractive power from the total OPD. Also measured in diopters, this measurement helps differentiate the effects of corneal and surface refractive error from internal aberrations (e.g., lenticular anomalies).
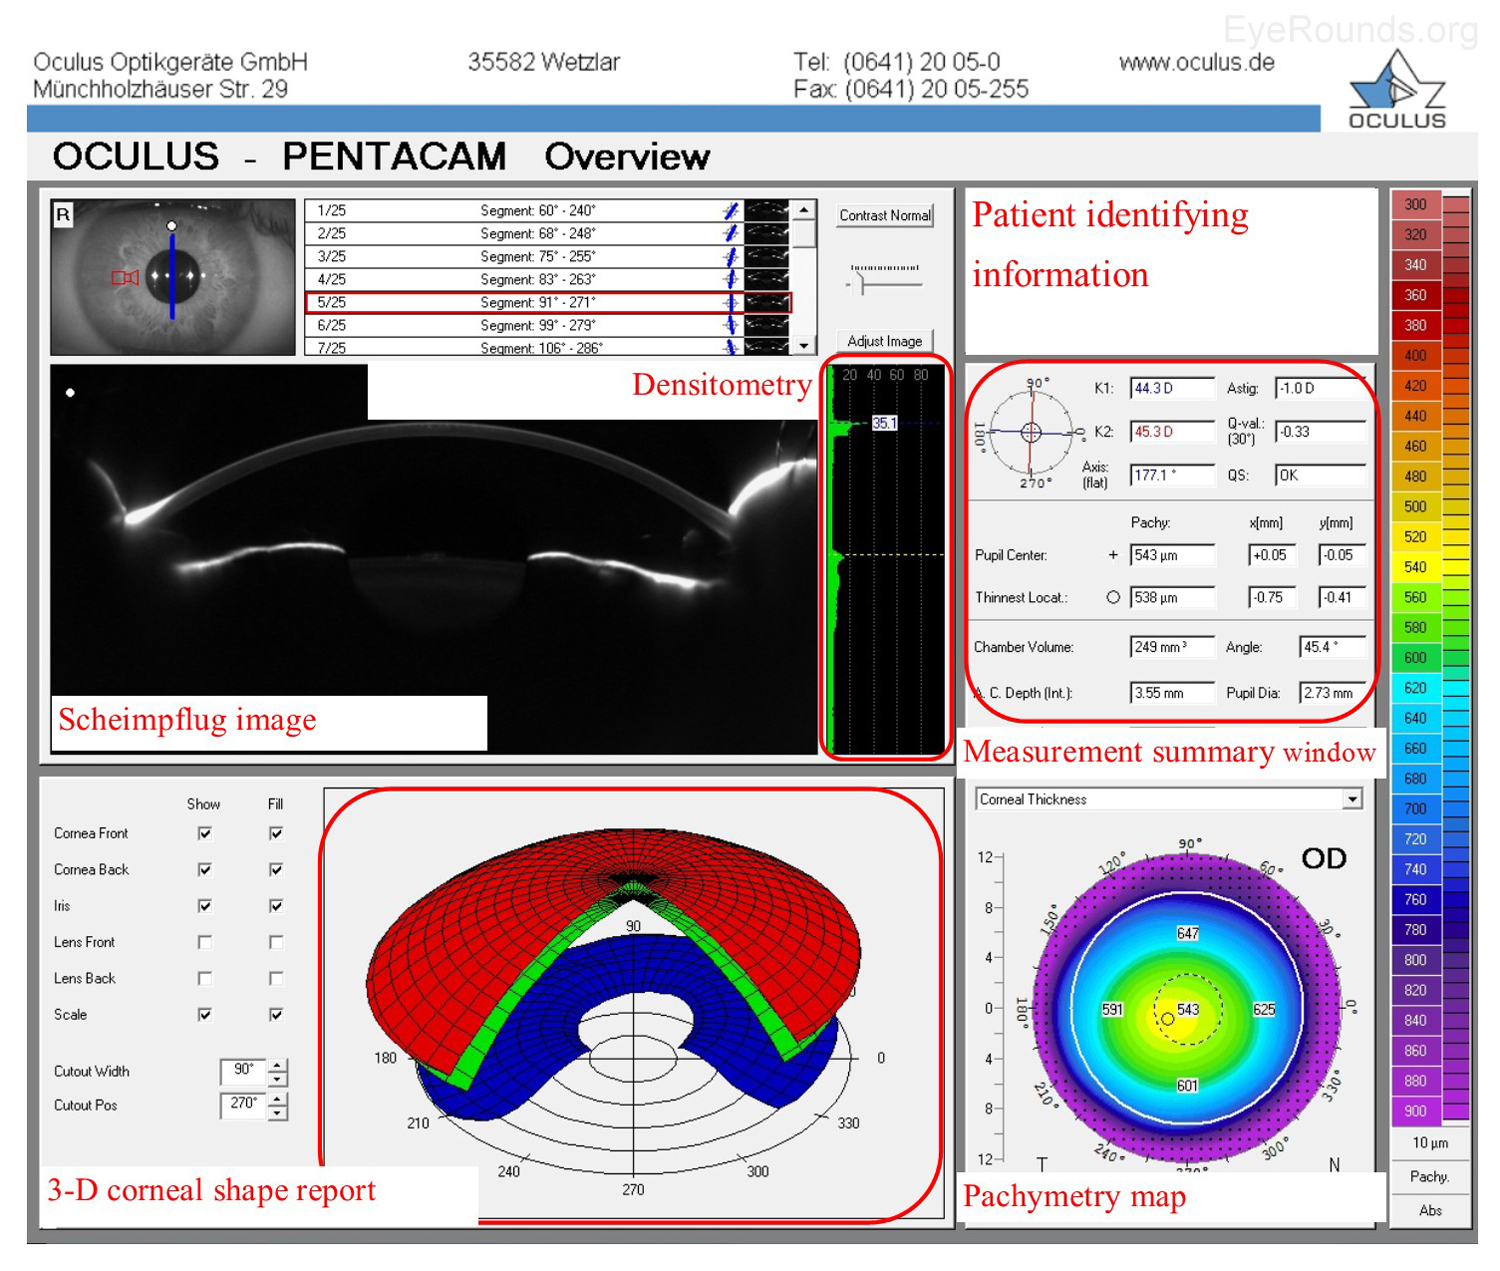
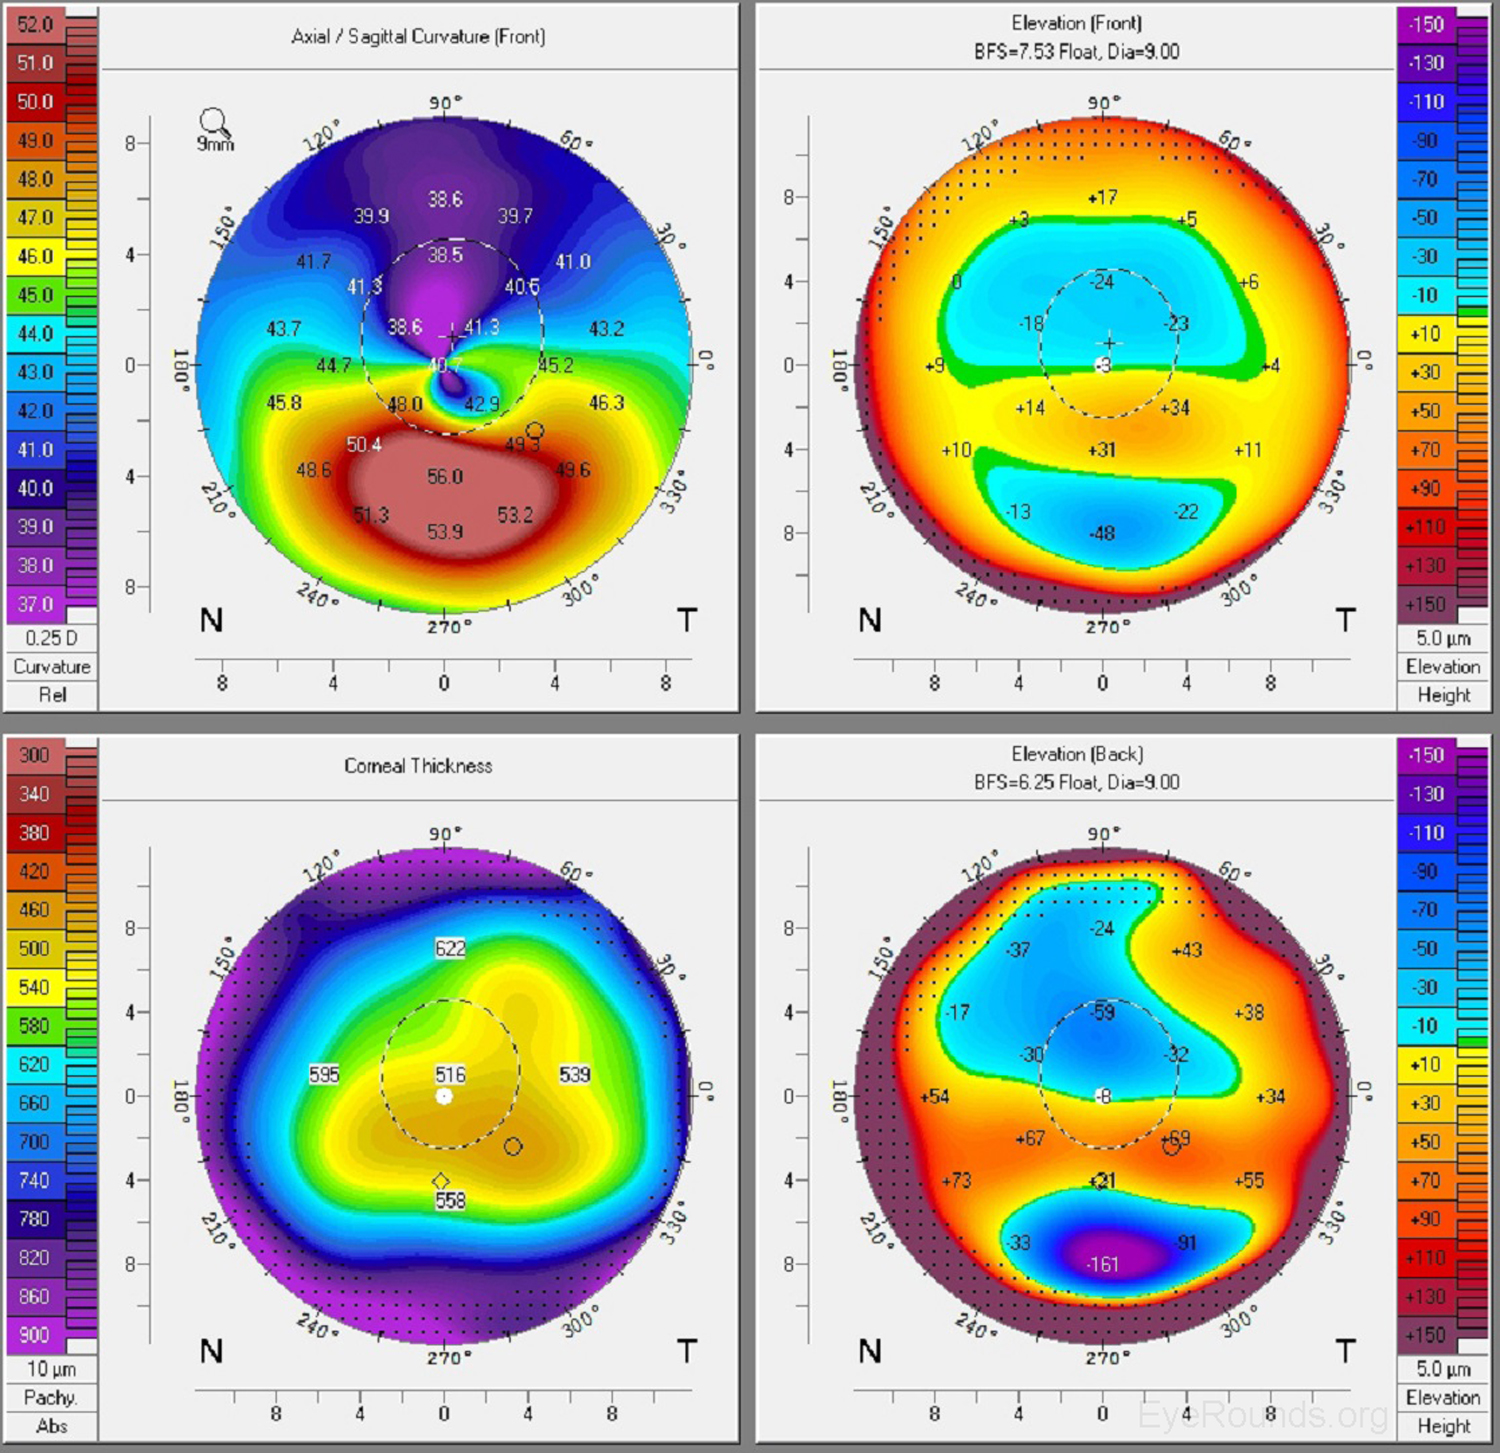
The Oculus Pentacam utilizes Scheimpflug technology to create topographic reports. The reports contain a great deal of information, and samples of the overview report and the 4 maps report are provided below (Figure 5A-B). Specifically, the overview report provides the Scheimpflug image, which is a cross-sectional image showing the cornea, anterior chamber, iris, and lens. A 3-D representation of the patient's corneal shape is also provided. The density of the cornea is evaluated using densitometry, which is an objective measurement of light scatter in the cornea. Any densitometry value less than ~30 is considered normal; thus, a condition resulting in decreased corneal clarity (e.g., corneal edema) will increase the densitometry value. There is also a convenient summary of the keratometry, pachymetry, and other numeric measurements in this report. A pachymetry color map indicates corneal thickness.
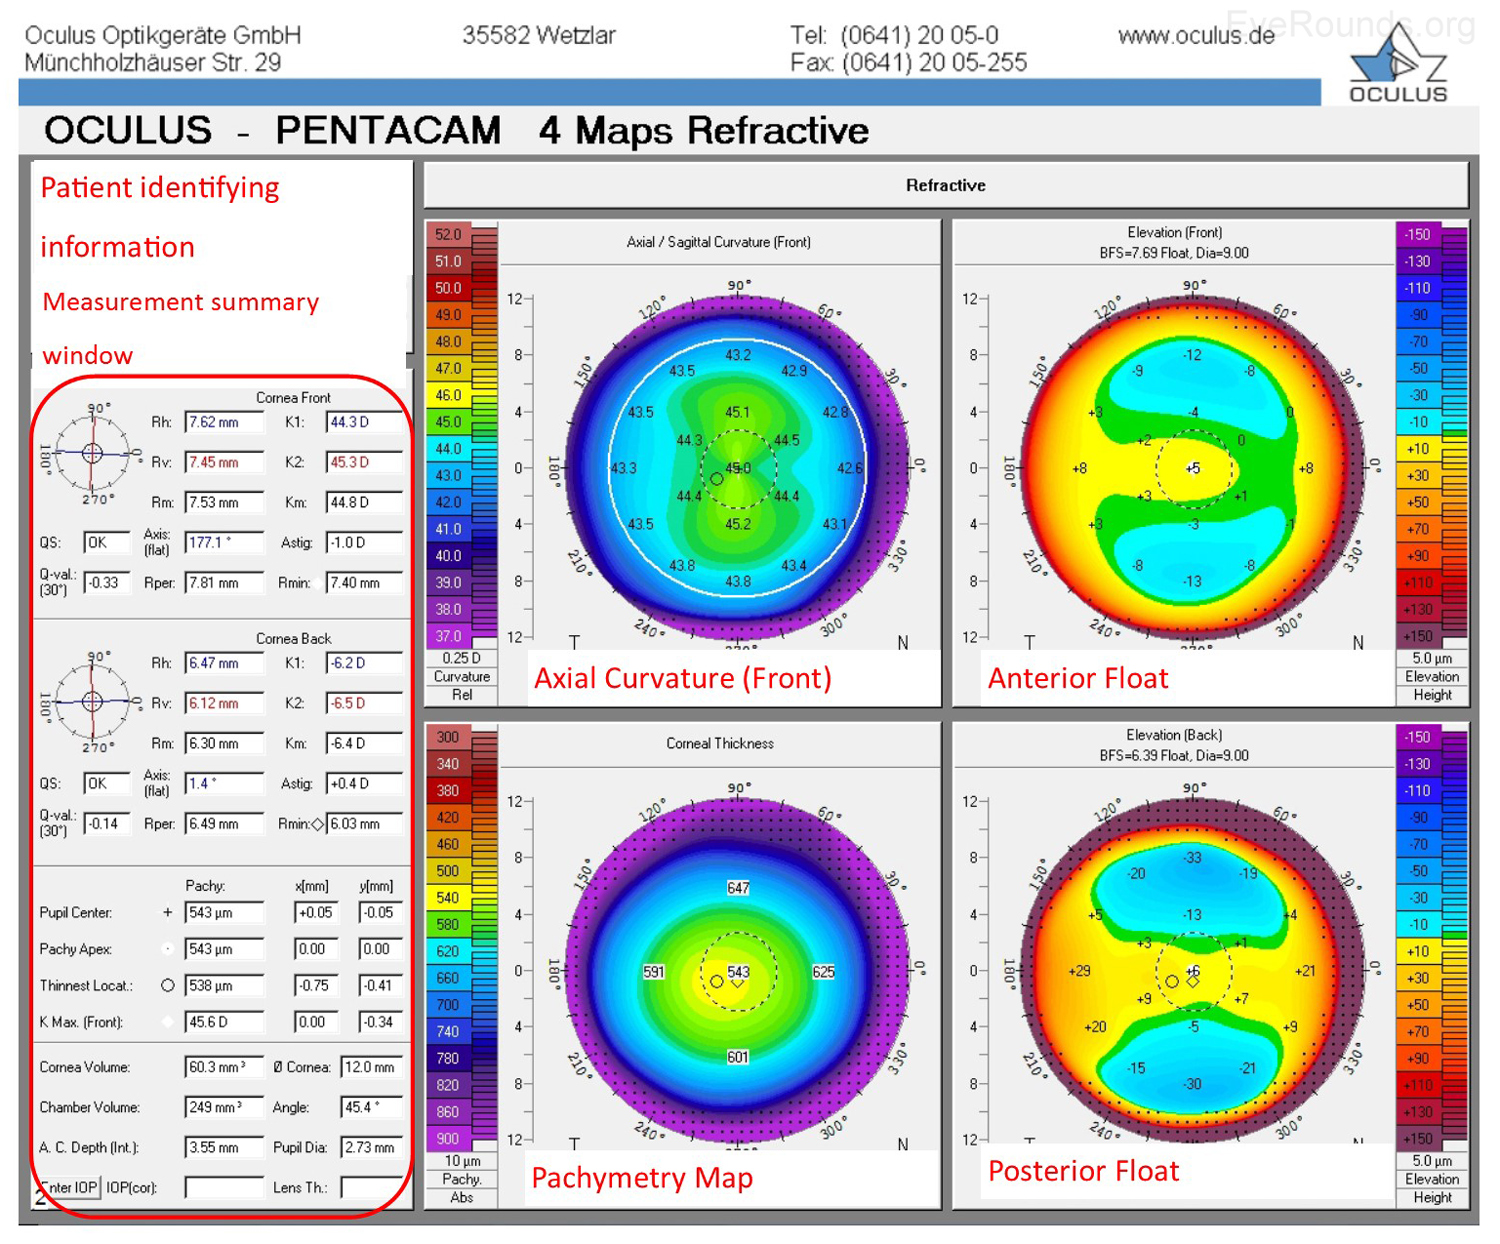
The Pentacam 4 maps report also provides a summary of keratometry, pachymetry with map, and other numeric measurements. Similar to the NIDEK report, the Pentacam report includes an axial map that depicts the curvature of the anterior corneal surface in dioptric values for each point.
Anterior float and posterior float images, which are elevation maps, are generated on the Pentacam report. Instead of displaying the refractive power of the cornea, elevation maps display the shape of the cornea by comparing it to a computer-generated best-fit sphere (i.e., a perfect sphere that best approximates the corneal shape on average). Posterior float, similar to the anterior float, shows the shape of the posterior cornea compared to a best-fit sphere.
Keratoconus, the most common corneal ectasia, is a progressive corneal condition characterized by central thinning and steepening of the cornea. Early keratoconus often looks normal on slit lamp examination, and manual keratometry, which assesses the central 3 mm, may give an insufficient assessment. Because of this, topography has become the gold standard for screening patients for keratoconus and other corneal ectasias (Figures 6-8).
Once an ectasia (e.g., keratoconus, Pellucid marginal corneal degeneration) is diagnosed, topography may be useful for monitoring disease progression. With regular surveillance topography, it can be determined when patients are at risk for progression and complications, and this precise monitoring allows early intervention with treatments such as collagen cross-linking or keratoplasty. Topographic warning signs include high central corneal power, a large difference between the two corneas of a patient, and a large disparity between the refractive power at the apex and the periphery (Figures 6-8) (5).
Laser refractive surgeries such as photorefractive keratectomy (PRK) and laser assisted in situ keratomileusis (LASIK) use excimer laser to ablate tissue and reshape the cornea to correct an individual's refractive error. Not every patient, however, can safely undergo these procedures. Screening must be performed to determine corneal shape and patterns of astigmatism on topography before refractive surgery can safely be performed. Topography can also be used post-operatively to evaluate etiology for unsatisfactory visual outcome such as decentered or incomplete ablations.
During cataract surgery, an intraocular lens is placed in the eye to achieve the desired refractive outcome. Standard intraocular lenses only contain spherical correction. If a patient has regular corneal astigmatism, however, an astigmatism-correcting toric lens may be used. Corneal topography is a useful pre-operative test to assess the magnitude and regularity of corneal cylinder when selecting an intraocular lens implant prior to cataract surgery.
After keratoplasty, corneal astigmatism can be evaluated with topography. This technology guides selective suture removal and other interventions to reduce levels of astigmatism.
Ocular surface disorders, such as pterygia, corneal scars, and Salzmann nodules, can induce irregular corneal astigmatism. Corneal topography can be used to evaluate the refractive effects of these problems and to aid in disease monitoring and surgical planning.
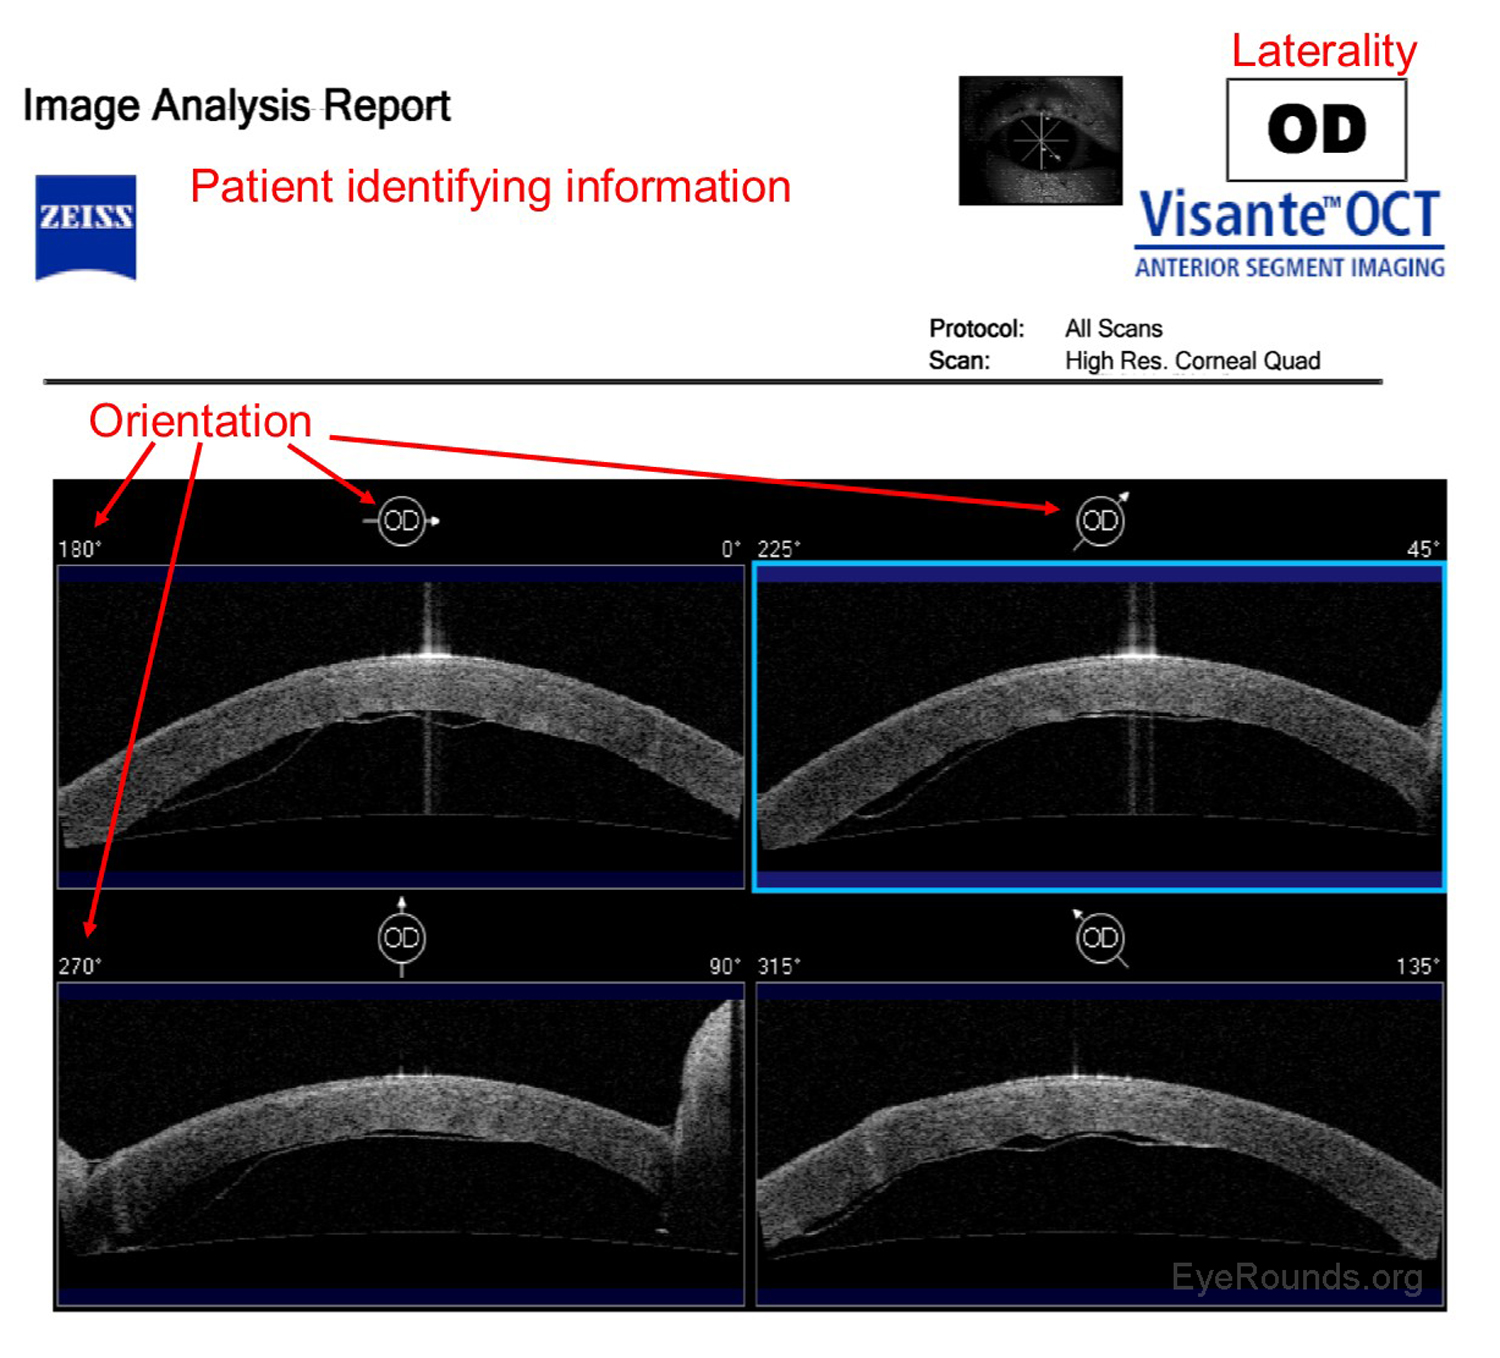
Anterior segment optical coherence tomography (AS-OCT) produces high-resolution imaging of the cornea, iris, and anterior chamber (e.g., Visante). It is analogous to ultrasound, but it utilizes light waves instead of sound to produce extremely high-resolution images of very small ocular structures (Figures 9 and 10). AS-OCT uses two scanning beams of light that are reflected off an ocular structure and then detected and compared to a reference beam to create a cross-sectional image (6).
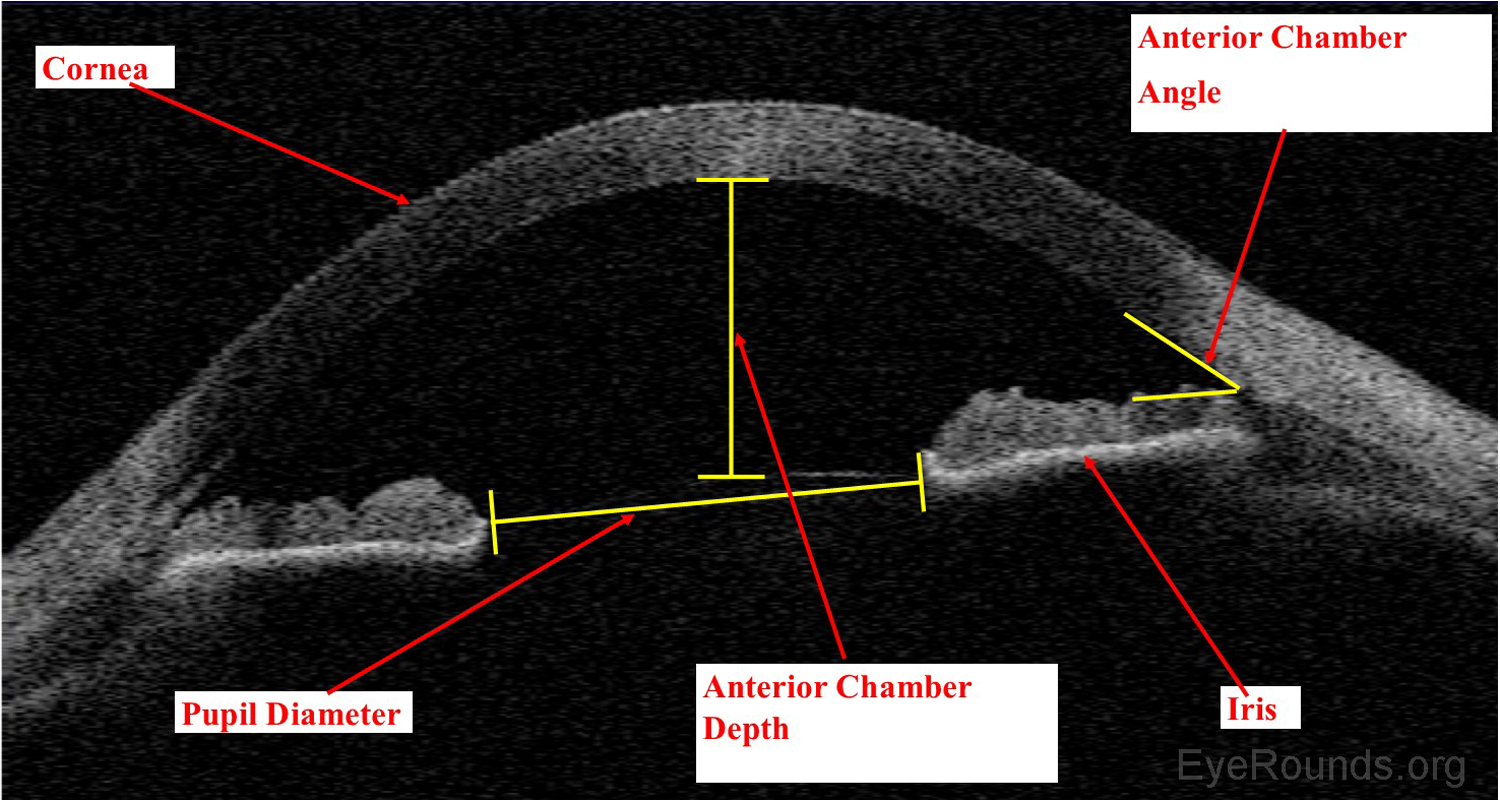
AS-OCT allows both qualitative and quantitative assessment of the iridocorneal angle. It is can be used as an adjunct to gonioscopy for glaucoma diagnosis and management.
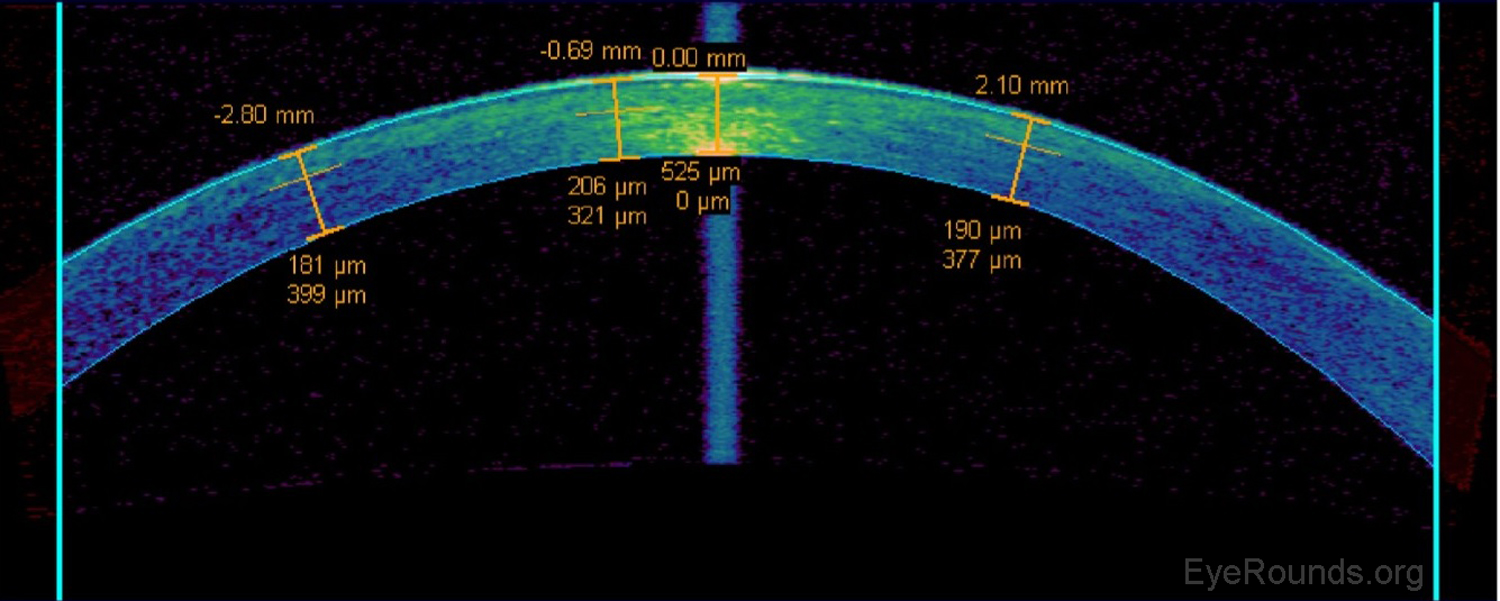
AS-OCT can be used to measure the residual stromal bed beneath a LASIK flap when determining whether or not there is sufficient stroma remaining to perform a flap lift and enhancement (Figure 11).
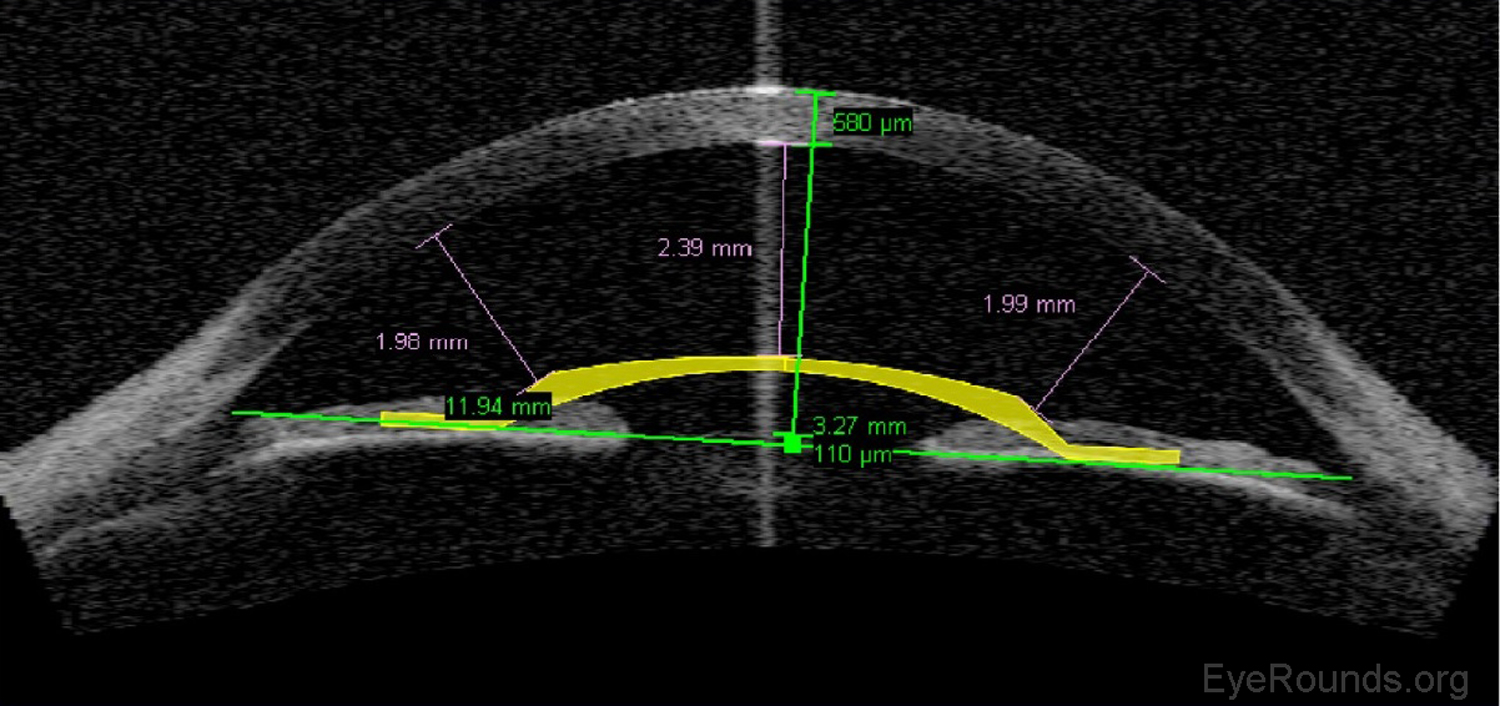
Phakic intraocular lens implants (e.g., Verisyse™) can be placed in series with the natural crystalline lens for correction of high myopia. The AS-OCT allows detailed measurements of the anterior chamber dimensions to assess whether or not sufficient anterior chamber space is available for one of these lens implants (Figure 12) (7).
AS-OCT is a useful adjunct to slit lamp examination for the assessment of endothelial graft adherence during the immediate postoperative period
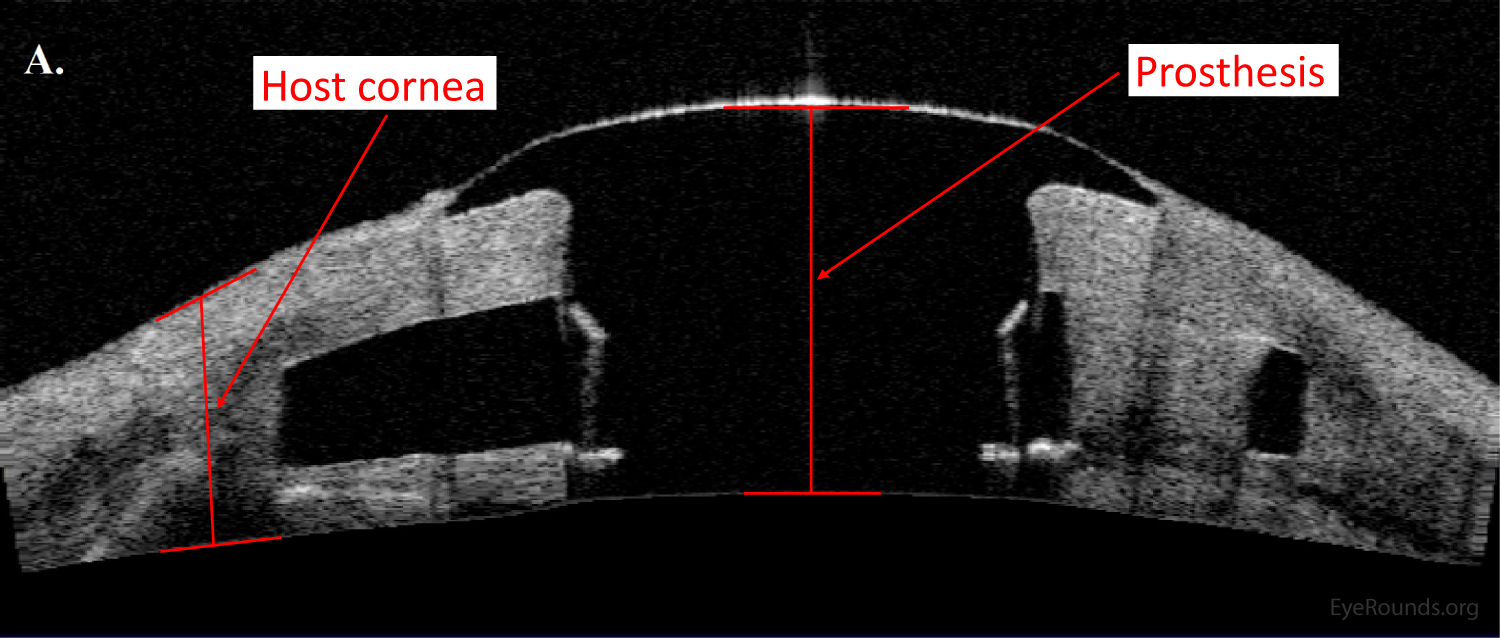
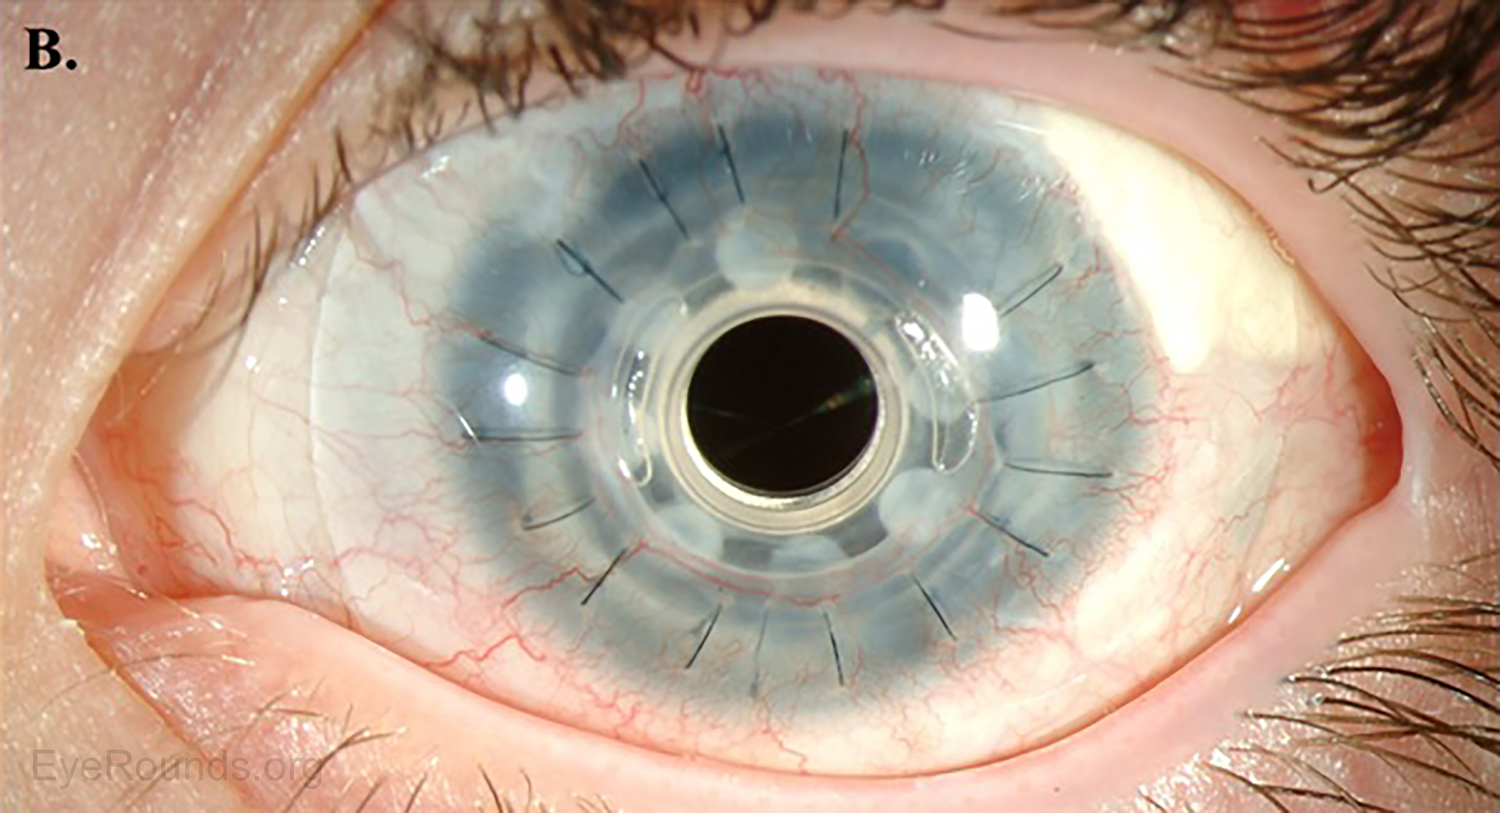
AS-OCT can provide additional information regarding structural integrity of prosthetic corneas, such as the Type I Boston keratoprosthesis (Figure 14).
Confocal microscopy is an imaging technique that allows in vivo examination of corneal structures at high magnification and resolution. Building off of imaging principles developed for neuronal imaging, confocal microscopy was first used to study the cornea in the 1990s (9-10). The device (e.g., NIDEK Confoscan, Heidelberg HRTII) allows characterization of each of the five corneal layers by simultaneously illuminating and imaging a single point of tissue (Figure 14) (11). The point light source and the camera are in the same plane, hence the name "confocal." Modern confocal microscopes scan small regions of tissue, illuminating and imaging thousands of points of tissue to create the final confocal image (10). By scanning different thickness levels of certain tissues in the anterior segment, significant information about structure and function at the cellular level can be gained.
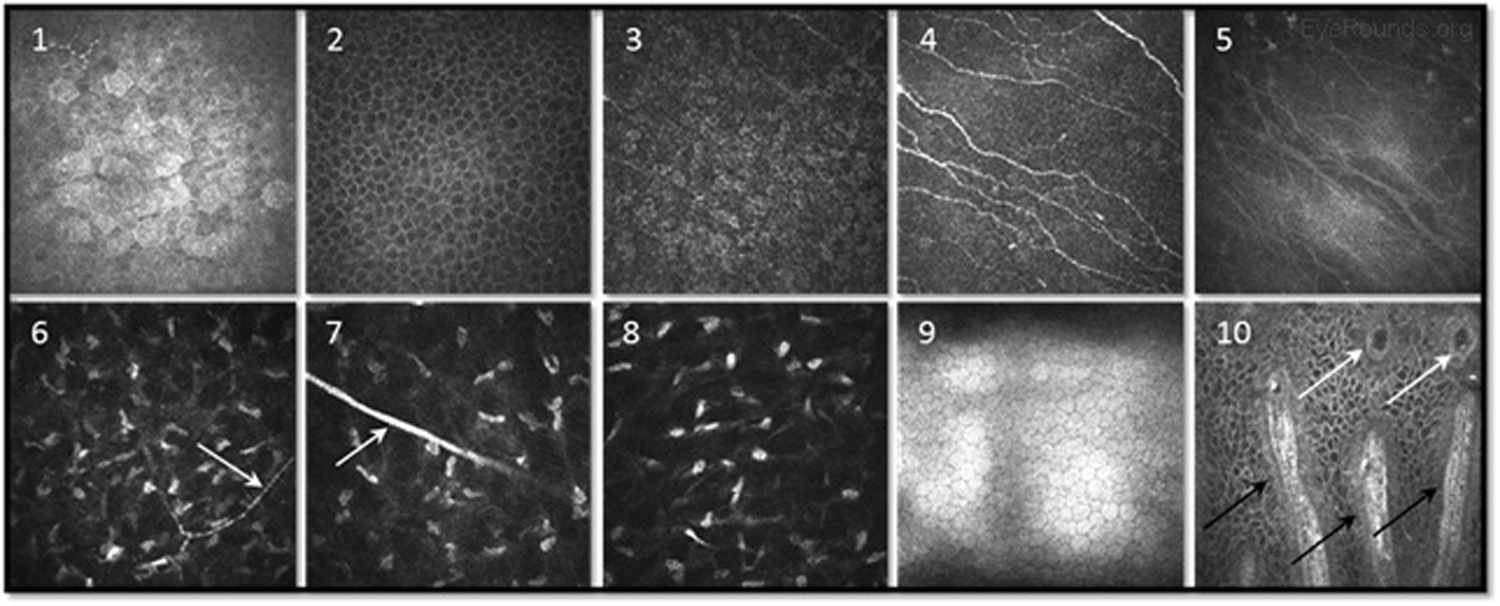
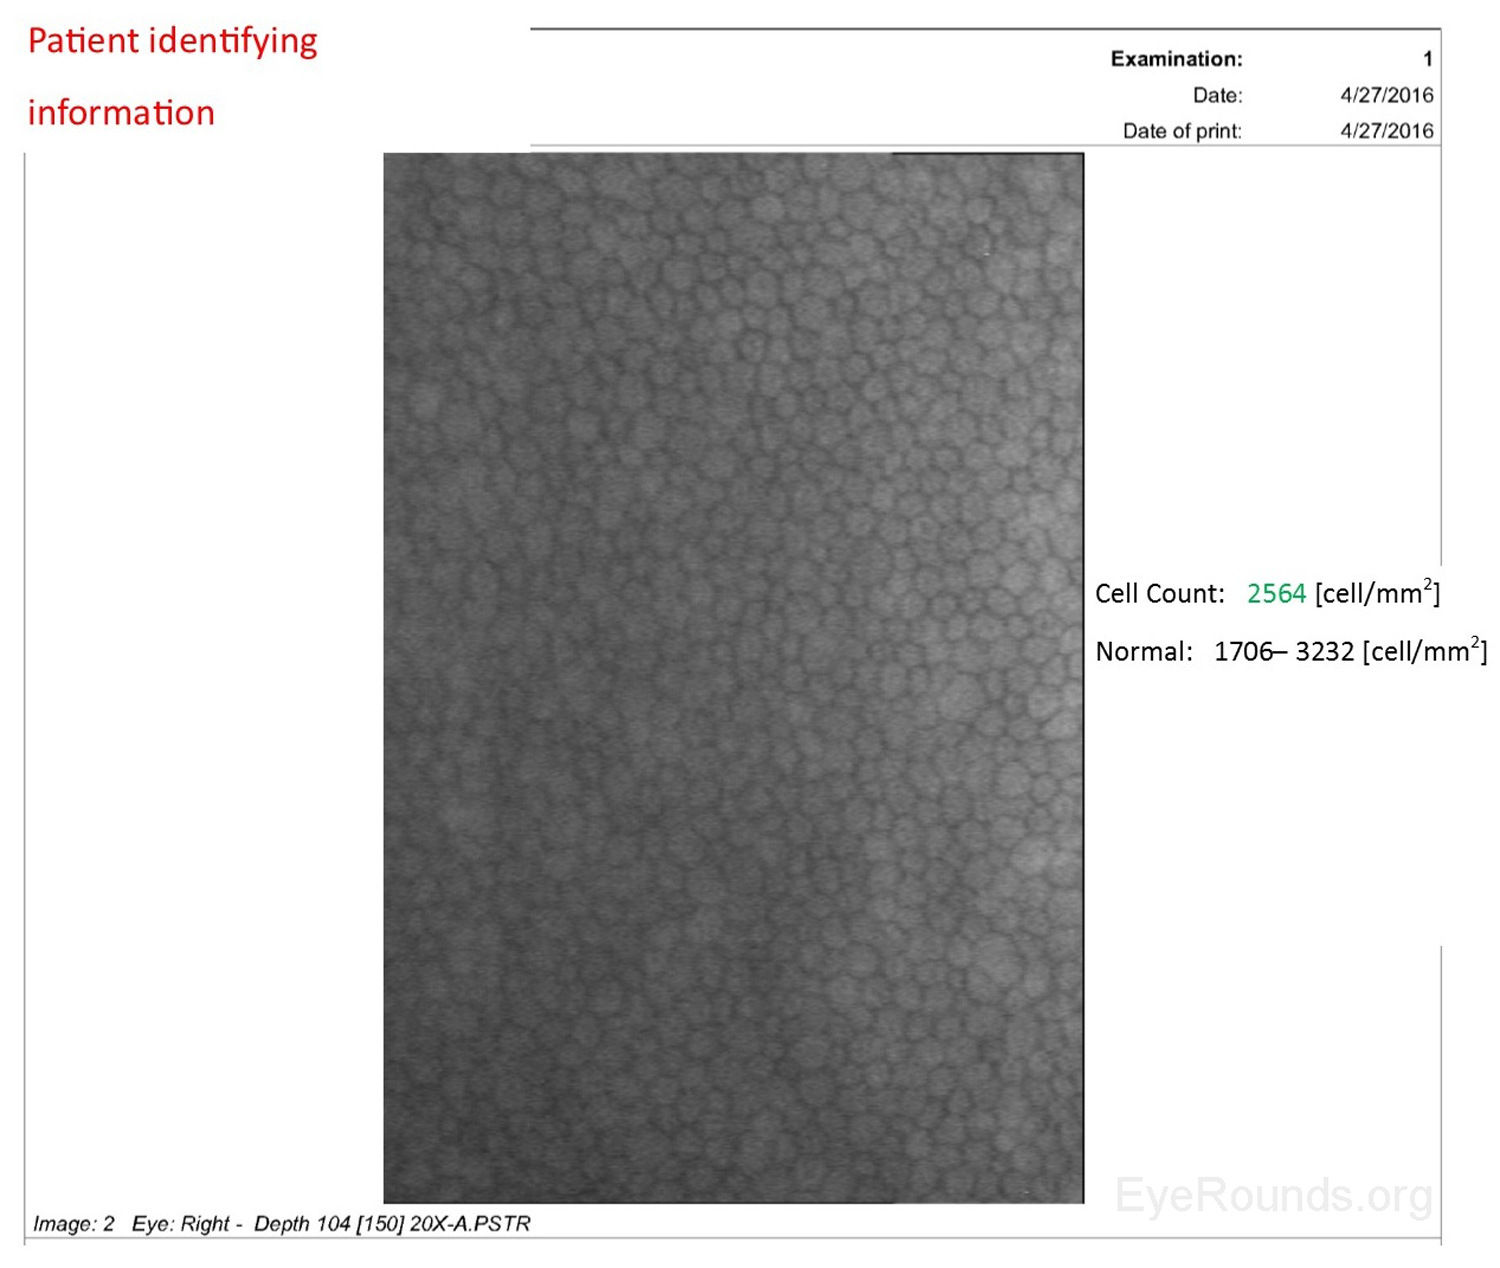
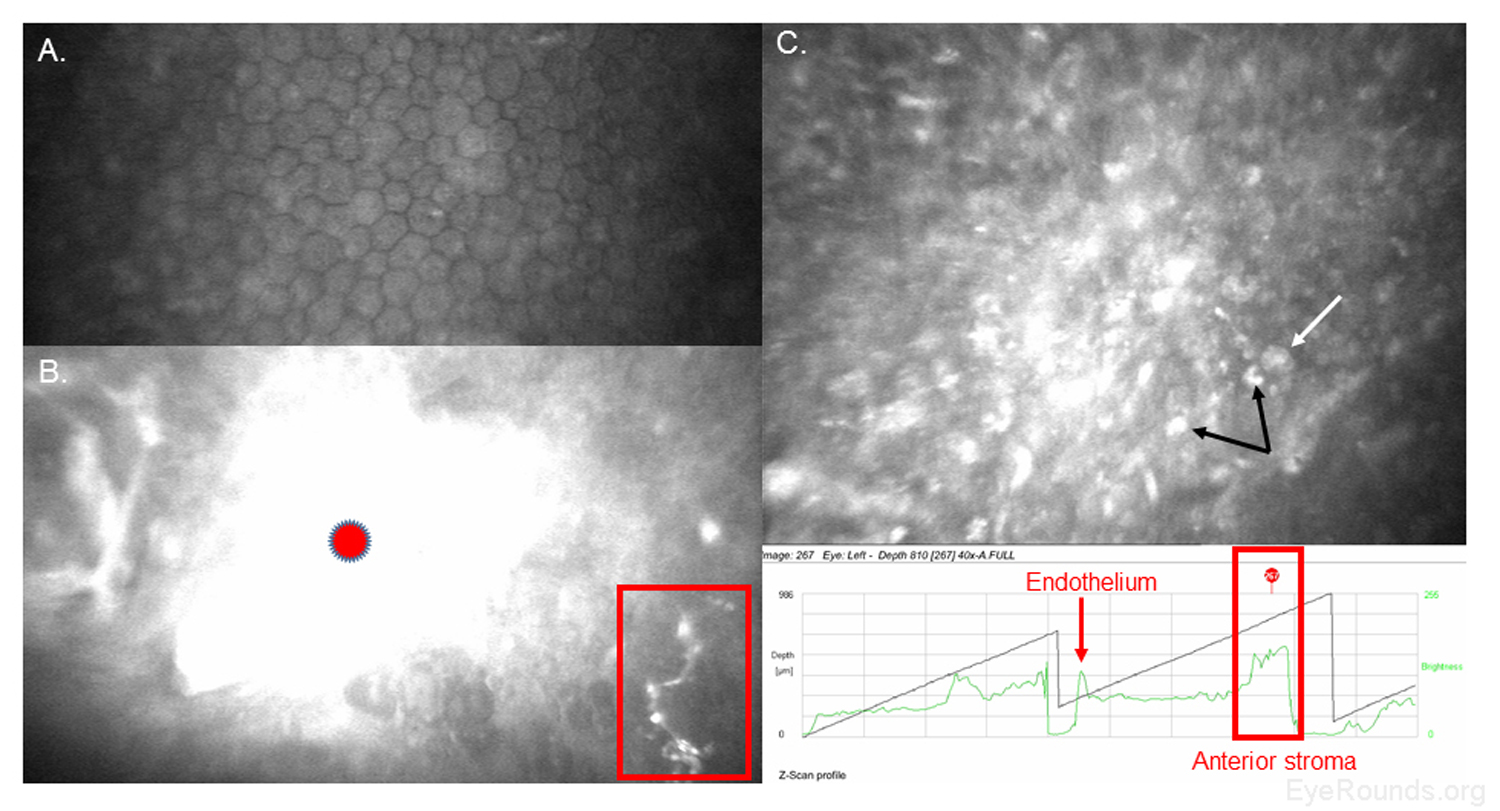
When used to assess endothelial cell health, both qualitative inspection of the endothelium and quantitative assessment of the endothelial cell density must be performed. Normal endothelial cells should appear small, hexagonal, and uniform. Pleomorphism is the presence of high variation in cell shape, while polymegathism is variation in cell size. Endothelial cell density can be obtained automatically or by manual counting and is expressed as cells/mm2 (Figure 15).
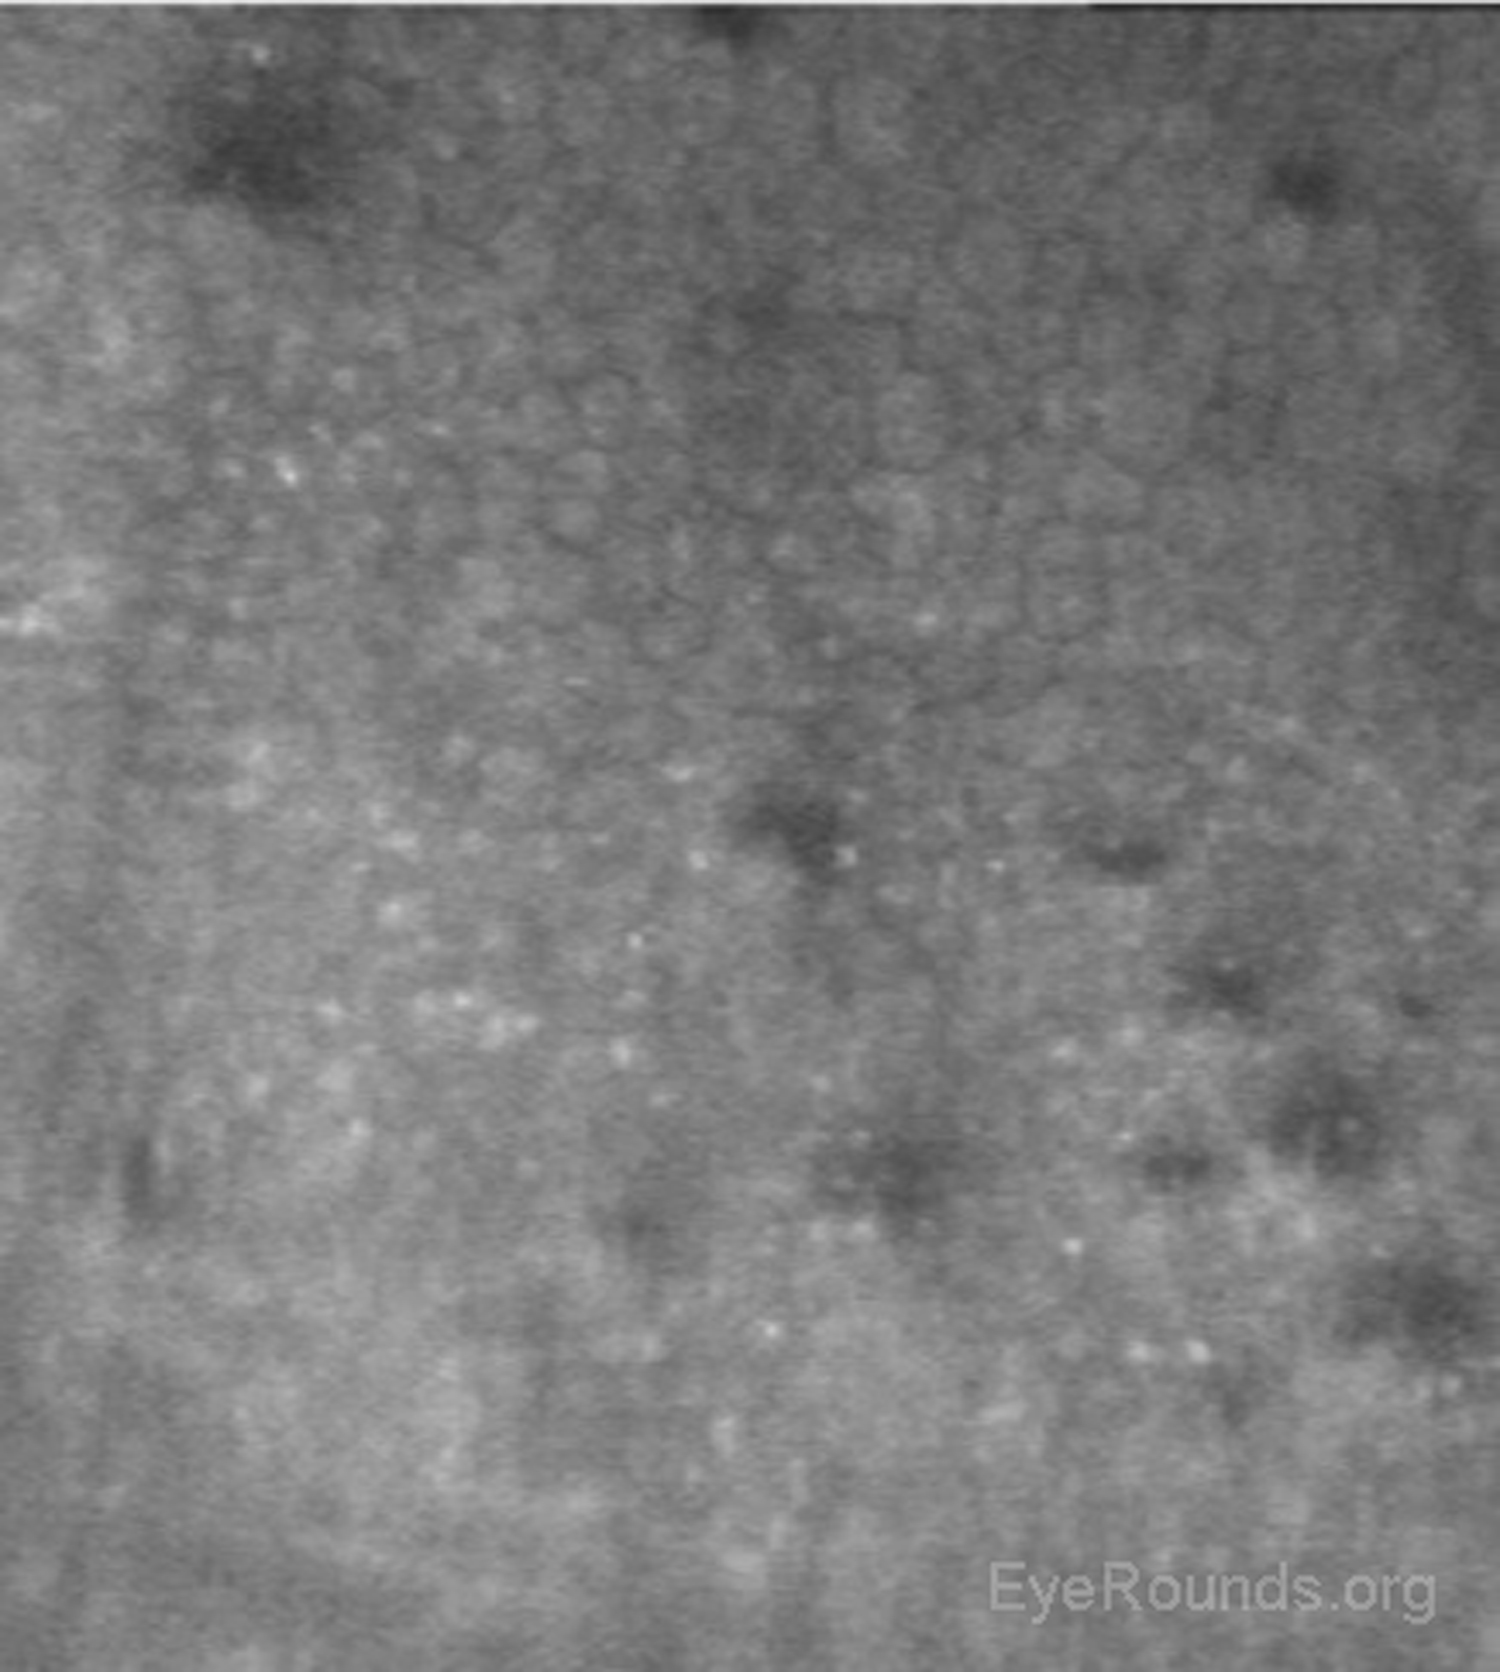
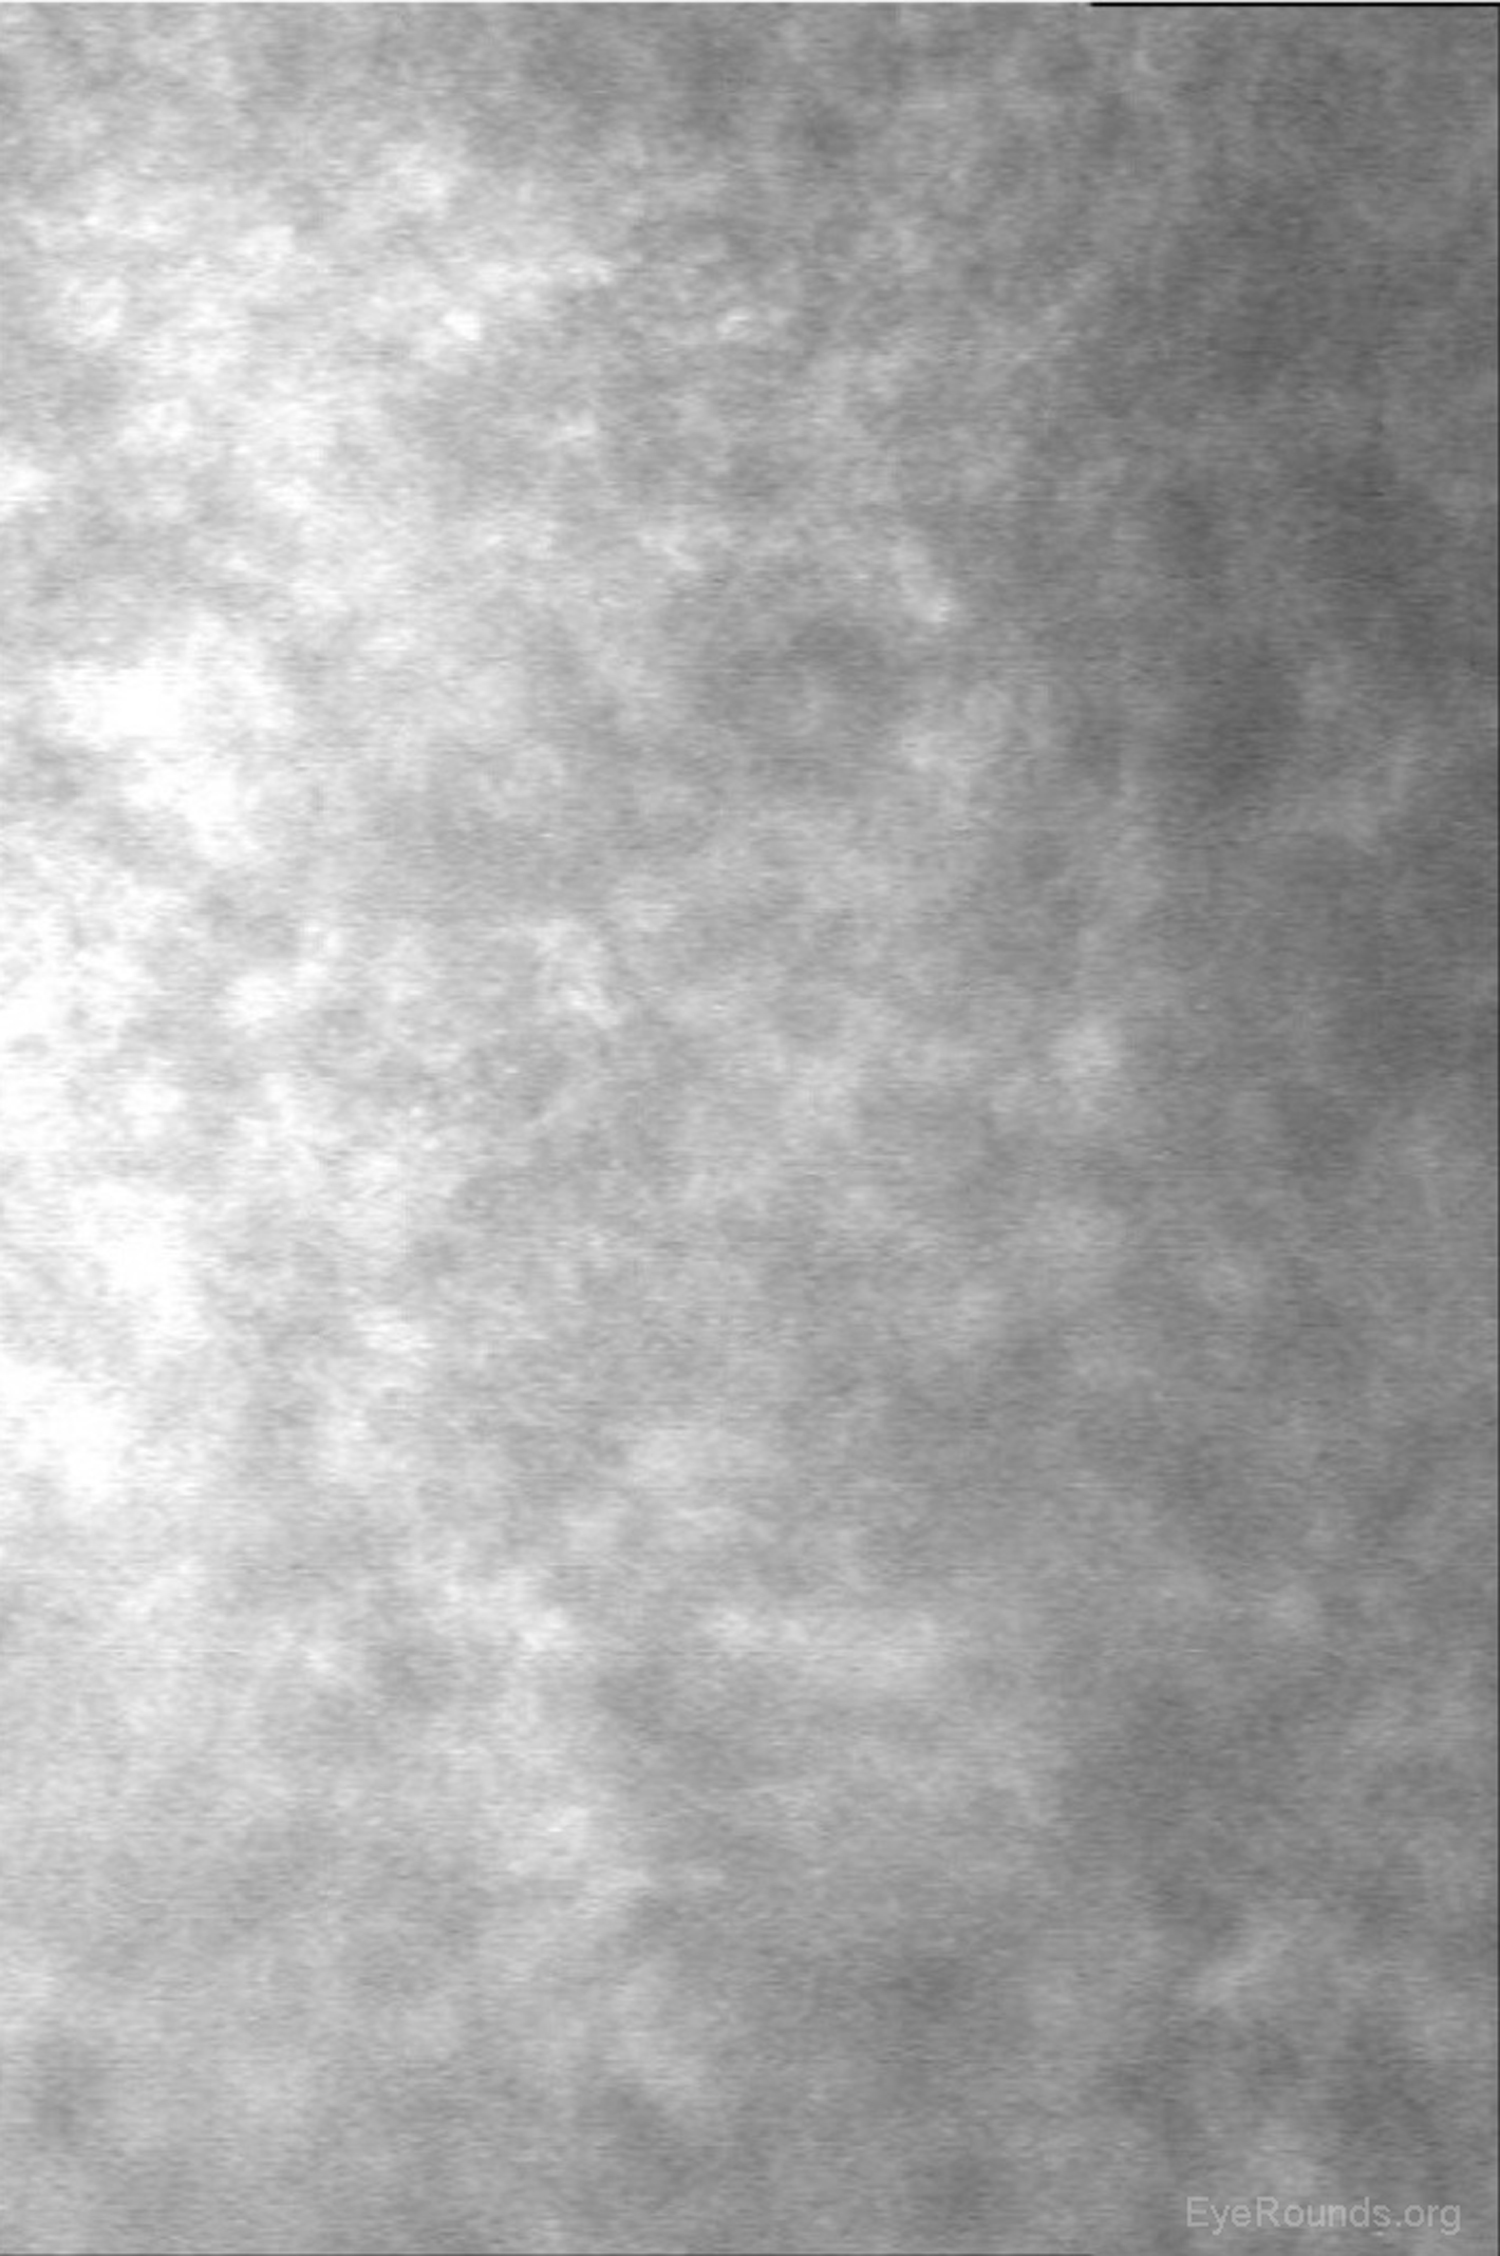
Examination of the corneal endothelium at a cellular level allows qualitative and quantitative evaluation of the cells. Endothelial cell size, shape, and density can all be characterized, which provides important information for diagnosing and managing posterior corneal dystrophies, such as Fuchs dystrophy (Figure 16), iridocorneal endothelial (ICE) syndrome, and posterior polymorphous dystrophy. The confocal microscope can help with diagnostic decisions, such as whether post-keratoplasty edema is due to corneal graft rejection (evidenced by inflammatory cells visualized) or endothelial decompensation (evidenced by low endothelial cell density) (Figure 17) (7, 10).
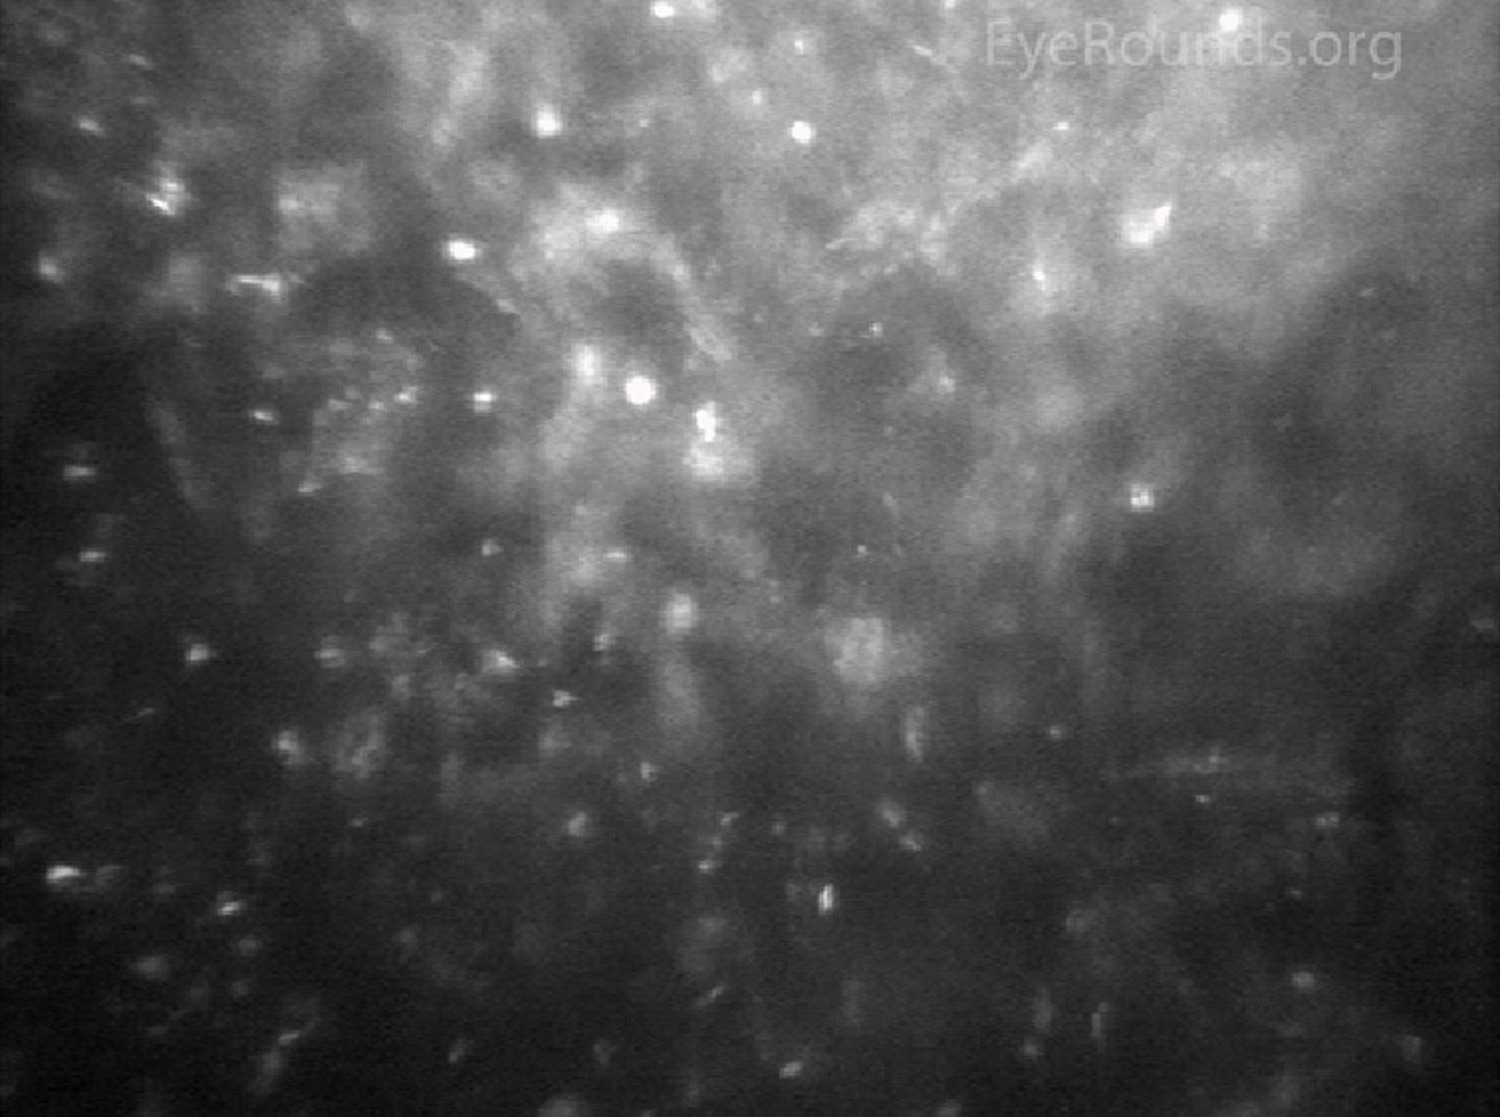
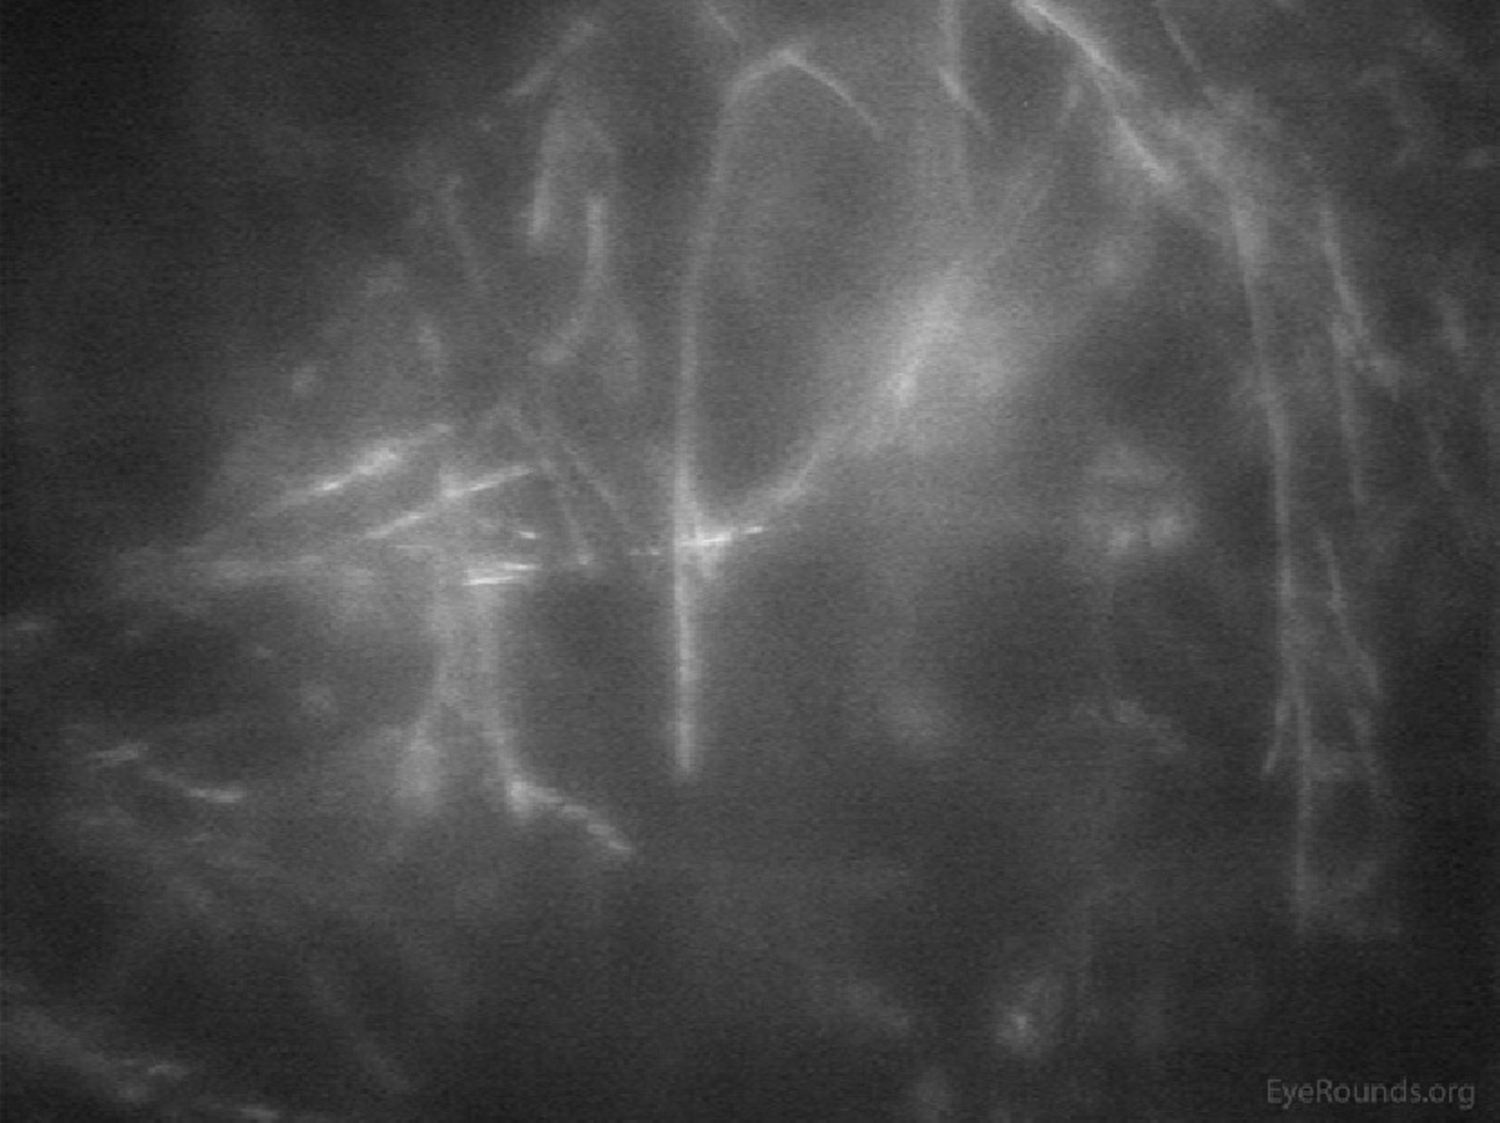
Infectious keratitis is a vision-threatening condition in which prompt diagnosis is imperative to preserve vision and the eye. Confocal microscopy is a useful adjunct to help rapidly identify the causative agent in vivo, such as fungi or Acanthamoeba, so appropriate treatment can be initiated. Acanthamoeba appear in their cystic form as highly-reflective ovoid structures (Figures 18 and 19). Fungi may appear as brightly reflective filaments and may have evidence of septations (Figure 20) (9).
Confocal microscopy can help quantify pathology of the subbasal nerve plexus in patients with neurotrophic keratopathy and diabetic neuropathy involving the cornea.
Similar to OCT, confocal microscopy can measure the depth of structures, such as deposits, scars, or LASIK flaps within the cornea to aid with surgical planning.
Ophthalmology is a rapidly advancing field with new technology for diagnosis and treatment being developed and implemented each year. As more advanced techniques (e.g., LASIK, endothelial keratoplasty) develop, the utility of advanced corneal imaging technique continues to grow. This tutorial has aimed to provide an overview of corneal imaging topics and to give trainees a foundation to build upon as they master the use of these fundamental tools of modern clinical ophthalmology.
Greenwald MF, Scruggs BA, Vislisel JM, Greiner MA. Corneal Imaging: An Introduction. EyeRounds.org. Posted October 19, 2016; Available from: https://eyerounds.org/tutorials/corneal-imaging/index.htm

Address
University of IowaLegal
Related Links
